Transactions
Transactions
Transactions

You also want an ePaper? Increase the reach of your titles
YUMPU automatically turns print PDFs into web optimized ePapers that Google loves.
550 TRANSACTIONS OF TH E A.S.M.E. AUGUST, 1941<br />
from jacket No. 6 was consistently lower than th a t in either of the<br />
adjacent jackets. Even when steam was not supplied to the first<br />
three jackets, jacket No. 6 (which was then the third heated<br />
jacket) gave less condensate than jackets Nos. 5 or 7. I t was concluded<br />
that the conditions for heat transfer in jacket No. 6 were<br />
not as favorable as in the adjacent jackets, possibly due (a) to a<br />
partial blocking of the air vent, or (b) to a partly clogged condensate<br />
drain line which caused the lower part of the tube to be<br />
immersed in condensate. Accordingly, all data from jacket No. 6<br />
have been deleted from the subsequent correlations, except that<br />
the actual rate of heat transfer in jacket No. 6 was used to calculate<br />
the cumulative vaporization in subsequent jackets.<br />
The local over-all coefficient of heat transfer in the boiling<br />
section is plotted in Fig. 8 versus the cumulative weight per cent<br />
of the feed vaporized, for all of the runs on water. The feed rate<br />
ranges from 58,000 to 185,000 lb per hr per sq ft of cross section,<br />
corresponding to inlet velocities of 0.27 to 0.85 fps. Arrows are<br />
used to designate data taken on a jacket immediately following a<br />
sure, he observed that high coefficients were obtained at the lowest<br />
temperature differences, that the heat-transfer coefficient went<br />
through a minimum a t 8 to 10 F, and that further increases in<br />
temperature difference resulted in an increase in the coefficient.<br />
The high coefficients at low temperature differences may be<br />
specific to low temperature differences, or may possibly result<br />
from (a) small errors in measuring the temperatures, which would<br />
cause a large percentage error in the small temperature difference,<br />
or (6) the use of a length-mean temperature difference, despite a<br />
variation in local heat-transfer coefficient along the tube. For<br />
purposes of comparison with the data of this paper, in which<br />
temperature differences below 14 F were never employed, the<br />
coefficients obtained by Stroebe when boiling water at 200 F have<br />
been plotted in Fig. 9, versus the total per cent of the feed vaporized,<br />
arbitrarily deleting all coefficients based upon temperature<br />
differences of less than 3 F. On the same plot are shown the data<br />
of this paper for the boiling section of all runs on water, calculated<br />
as average coefficients (cf. Table 2) by dividing the total heat<br />
flux in the boiling section by the length-mean temperature<br />
difference.<br />
Both sets of data plotted in Fig. 9, indicate a decrease in the<br />
heat-transfer coefficient as the discharge end of the tube becomes<br />
vapor-bound, due to excessive cumulative vaporization. In<br />
fact, Stroebe observed that as the fluid left the tube, under some<br />
conditions (particularly high over-all temperature difference),<br />
all of the liquid seemed to be carried as a spray up the center of<br />
F i g . 9 P l o t o f A v e r a g e H e a t - T r a n s f e r C o e f f i c i e n t i n E n t i r e<br />
B o i l i n g S e c t i o n V e r s u s T o t a l P e r C e n t o f F e e d V a p o r i z e d ,<br />
a n d C o m p a r i s o n W i t h S im i l a r D a t a T a k e n a t U n i v e r s i t y o f<br />
M ic h i g a n (5 ) i n a V e r t i c a l T u b e<br />
return bend when the cumulative vaporization was in excess of<br />
60 per cent.<br />
In Fig. 8, over a range of cumulative per cent vaporization<br />
from 2 to 70 per cent, the coefficients fall in a band of points having<br />
a maximum deviation of about 25 per cent from the average<br />
coefficient at any given value of p. At vaporizations of less than<br />
10 per cent, the higher steam pressures (about 24 psi gage) give<br />
coefficients higher than the lower steam pressures (about 10 psi).<br />
This beneficial effect of increasing temperature difference fades<br />
out as higher cumulative vaporization is encountered, and the<br />
heat-transfer coefficients increase with increase in p and go<br />
through a flat maximum at about 40 per cent vaporized. At high<br />
values of p the heat-transfer coefficients decrease to well below<br />
1000. Based on meager data in this range, the coefficients obtained<br />
when using higher temperature differences (resulting from<br />
the use of higher steam pressures) are lower than when using<br />
lower temperature differences. This increase in vapor-binding at<br />
high cumulative vaporization is similar to that obtained with<br />
benzene, Fig. 7.<br />
In confirmation of the results obtained on water are the data of<br />
Stroebe, Baker, and Badger (5) who boiled water under various<br />
pressures inside a 1.76-in. vertical copper tube, 20 ft long.<br />
Mass velocities ranged from 14,400 to 126,000 lb per hr per sq ft<br />
of cross section, corresponding to inlet velocities of 0.065 to 0.58<br />
fps. However, the heat-transfer coefficients (based on an average<br />
temperature difference as measured with a traveling thermocouple)<br />
were correlated in terms of physical properties of the<br />
liquid and the temperature difference, independent of feed rate,<br />
except as varying the feed rate varied the mean temperature<br />
difference and, hence, the average liquid temperature. Film<br />
heat-transfer coefficients for boiling water varied from 1160 to<br />
2640.<br />
When Stroebe plotted his heat-transfer coefficients versus the<br />
temperature difference, for a given feed rate and discharge pres<br />
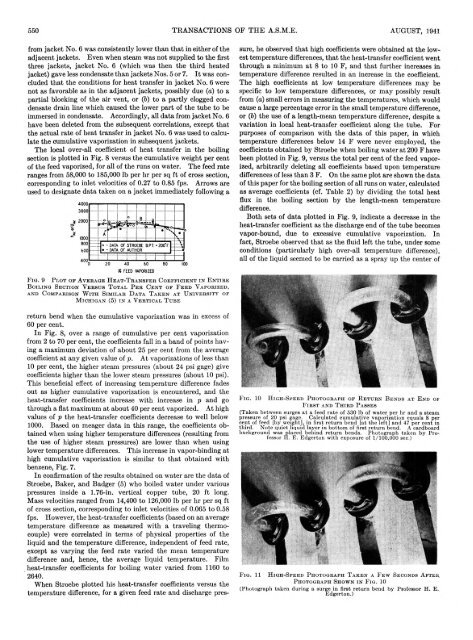
F i g . 1 0<br />
H i g h - S p e e d P h o t o g r a p h o f R e t u r n B e n d s a t E n d o f<br />
F i r s t a n d T h i r d P a s s e s<br />
(Taken between surges at a feed rate of 530 lb of water per hr and a steam<br />
pressure of 20 psi gage. Calculated cumulative vaporization equals 8 per<br />
cent of feed [by weight], in first return bend [at the left] and 47 per cent in<br />
third. Note quiet liquid layer in bottom of first return bend. A cardboard<br />
background was placed behind return bends. Photograph taken by Professor<br />
H. E. Edgerton with exposure of 1/100,000 sec.)<br />
F i g . 11 H i g h - S p e e d P h o t o g r a p h T a k e n a F e w S e c o n d s A f t e r .<br />
P h o t o g r a p h S h o w n i n F i g . 10<br />
(Photograph taken during a surge in first return bend by Professor H . E .<br />
Edgerton.)