Waste reduction final report -4 - Test Input
Waste reduction final report -4 - Test Input
Waste reduction final report -4 - Test Input

You also want an ePaper? Increase the reach of your titles
YUMPU automatically turns print PDFs into web optimized ePapers that Google loves.
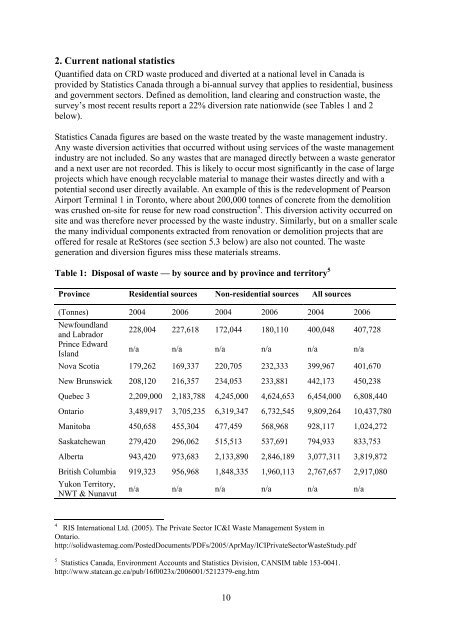
2. Current national statistics<br />
Quantified data on CRD waste produced and diverted at a national level in Canada is<br />
provided by Statistics Canada through a bi-annual survey that applies to residential, business<br />
and government sectors. Defined as demolition, land clearing and construction waste, the<br />
survey’s most recent results <strong>report</strong> a 22% diversion rate nationwide (see Tables 1 and 2<br />
below).<br />
Statistics Canada figures are based on the waste treated by the waste management industry.<br />
Any waste diversion activities that occurred without using services of the waste management<br />
industry are not included. So any wastes that are managed directly between a waste generator<br />
and a next user are not recorded. This is likely to occur most significantly in the case of large<br />
projects which have enough recyclable material to manage their wastes directly and with a<br />
potential second user directly available. An example of this is the redevelopment of Pearson<br />
Airport Terminal 1 in Toronto, where about 200,000 tonnes of concrete from the demolition<br />
was crushed on-site for reuse for new road construction 4 . This diversion activity occurred on<br />
site and was therefore never processed by the waste industry. Similarly, but on a smaller scale<br />
the many individual components extracted from renovation or demolition projects that are<br />
offered for resale at ReStores (see section 5.3 below) are also not counted. The waste<br />
generation and diversion figures miss these materials streams.<br />
Table 1: Disposal of waste — by source and by province and territory 5<br />
Province Residential sources Non-residential sources All sources<br />
(Tonnes) 2004 2006 2004 2006 2004 2006<br />
Newfoundland<br />
and Labrador<br />
Prince Edward<br />
Island<br />
228,004 227,618 172,044 180,110 400,048 407,728<br />
n/a n/a n/a n/a n/a n/a<br />
Nova Scotia 179,262 169,337 220,705 232,333 399,967 401,670<br />
New Brunswick 208,120 216,357 234,053 233,881 442,173 450,238<br />
Quebec 3 2,209,000 2,183,788 4,245,000 4,624,653 6,454,000 6,808,440<br />
Ontario 3,489,917 3,705,235 6,319,347 6,732,545 9,809,264 10,437,780<br />
Manitoba 450,658 455,304 477,459 568,968 928,117 1,024,272<br />
Saskatchewan 279,420 296,062 515,513 537,691 794,933 833,753<br />
Alberta 943,420 973,683 2,133,890 2,846,189 3,077,311 3,819,872<br />
British Columbia 919,323 956,968 1,848,335 1,960,113 2,767,657 2,917,080<br />
Yukon Territory,<br />
NWT & Nunavut<br />
n/a n/a n/a n/a n/a n/a<br />
4<br />
RIS International Ltd. (2005). The Private Sector IC&I <strong>Waste</strong> Management System in<br />
Ontario.<br />
http://solidwastemag.com/PostedDocuments/PDFs/2005/AprMay/ICIPrivateSector<strong>Waste</strong>Study.pdf<br />
5 Statistics Canada, Environment Accounts and Statistics Division, CANSIM table 153-0041.<br />
http://www.statcan.gc.ca/pub/16f0023x/2006001/5212379-eng.htm<br />
10