Waste reduction final report -4 - Test Input
Waste reduction final report -4 - Test Input
Waste reduction final report -4 - Test Input

You also want an ePaper? Increase the reach of your titles
YUMPU automatically turns print PDFs into web optimized ePapers that Google loves.
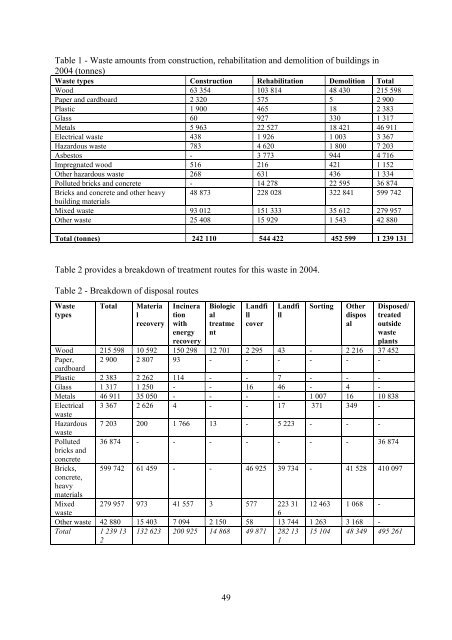
Table 1 - <strong>Waste</strong> amounts from construction, rehabilitation and demolition of buildings in<br />
2004 (tonnes)<br />
<strong>Waste</strong> types Construction Rehabilitation Demolition Total<br />
Wood 63 354 103 814 48 430 215 598<br />
Paper and cardboard 2 320 575 5 2 900<br />
Plastic 1 900 465 18 2 383<br />
Glass 60 927 330 1 317<br />
Metals 5 963 22 527 18 421 46 911<br />
Electrical waste 438 1 926 1 003 3 367<br />
Hazardous waste 783 4 620 1 800 7 203<br />
Asbestos - 3 773 944 4 716<br />
Impregnated wood 516 216 421 1 152<br />
Other hazardous waste 268 631 436 1 334<br />
Polluted bricks and concrete - 14 278 22 595 36 874<br />
Bricks and concrete and other heavy 48 873 228 028 322 841 599 742<br />
building materials<br />
Mixed waste 93 012 151 333 35 612 279 957<br />
Other waste 25 408 15 929 1 543 42 880<br />
Total (tonnes) 242 110 544 422 452 599 1 239 131<br />
Table 2 provides a breakdown of treatment routes for this waste in 2004.<br />
Table 2 - Breakdown of disposal routes<br />
<strong>Waste</strong><br />
types<br />
Total<br />
Materia<br />
l<br />
recovery<br />
Incinera<br />
tion<br />
with<br />
energy<br />
recovery<br />
Biologic<br />
al<br />
treatme<br />
nt<br />
Landfi<br />
ll<br />
cover<br />
Landfi<br />
ll<br />
Sorting<br />
Other<br />
dispos<br />
al<br />
Disposed/<br />
treated<br />
outside<br />
waste<br />
plants<br />
Wood 215 598 10 592 150 298 12 701 2 295 43 - 2 216 37 452<br />
Paper, 2 900 2 807 93 - - - - - -<br />
cardboard<br />
Plastic 2 383 2 262 114 - - 7 - - -<br />
Glass 1 317 1 250 - - 16 46 - 4 -<br />
Metals 46 911 35 050 - - - - 1 007 16 10 838<br />
Electrical<br />
waste<br />
Hazardous<br />
waste<br />
Polluted<br />
bricks and<br />
concrete<br />
Bricks,<br />
concrete,<br />
heavy<br />
materials<br />
3 367 2 626 4 - - 17 371 349 -<br />
7 203 200 1 766 13 - 5 223 - - -<br />
36 874 - - - - - - - 36 874<br />
599 742 61 459 - - 46 925 39 734 - 41 528 410 097<br />
Mixed 279 957 973 41 557 3 577 223 31 12 463 1 068 -<br />
waste<br />
6<br />
Other waste 42 880 15 403 7 094 2 150 58 13 744 1 263 3 168 -<br />
Total 1 239 13<br />
2<br />
132 623 200 925 14 868 49 871 282 13<br />
1<br />
15 104 48 349 495 261<br />
49