Waste reduction final report -4 - Test Input
Waste reduction final report -4 - Test Input
Waste reduction final report -4 - Test Input

You also want an ePaper? Increase the reach of your titles
YUMPU automatically turns print PDFs into web optimized ePapers that Google loves.
180 <br />
160 <br />
140 <br />
120 <br />
100 <br />
80 <br />
60 <br />
40 <br />
20 <br />
0 <br />
1996 2000 2003 <br />
TOTAL C&D <br />
RESIDENTIAL <br />
NON RESIDENTIAL <br />
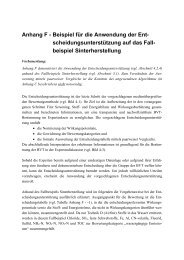
Figure 3 Total C&D generated in USA in last decade, MMT<br />
Franklin Associate data shown above assumes a value for C&D waste generated per unit area<br />
of buildings and uses that value to calculate the total C&D waste generation based on the<br />
annual volume of construction. The <strong>report</strong> uses 21.5 Kg/m 2 of waste generation for<br />
residential and 19.5 Kg/m 2 for non-residential construction in their calculations. These<br />
numbers coincide with other <strong>report</strong>s that a 187 m 2 house produces 3,630 Kg of debris.<br />
Demolition wastes were estimated based on 550 Kg/m 2 for residential and 850 Kg/m 2 for nonresidential<br />
buildings. These numbers will be used later in this <strong>report</strong> to establish benchmarks<br />
for better, good and standard practices for waste generation on a site depending on<br />
Residential or Non- Residential building.<br />
A different approach is to calculate the total C&D waste based on population. Table 4 shows<br />
the waste collected from various landfills throughout U.S. The collected data has been<br />
divided into three categories: a) C&D disposed (excluding recycled materials, b) C&D<br />
generated (including recycled materials), and c) C&D generated as a percentage of total<br />
MSW (30%). Based on the population of a region and the waste generated, one can find the<br />
waste per capita per day using the following formula:<br />
<strong>Waste</strong> in Kilogram per capita per day = <strong>Waste</strong> in MMT x 1000<br />
Population x 365<br />
As illustrated in Table 4, the C&D waste generation rate per capita per day ranges from 0.64<br />
to 1.46 kilograms. Considering a recycling rate of 25% the average generation rate for the<br />
first category may be estimated to be: 0.90 / 0.75 = 1.20 kg per capita.<br />
Overall average per capita per day may be calculated as follows:<br />
(1.20 + 1.02 + 0.99) / 3 = 1.07 Kg per capita per day<br />
Using the average per capita rate of 1.07 kilograms and U.S. population the total waste<br />
generated in each particular year can be calculated:<br />
1. Total waste generated in 1996<br />
Population of U.S. in 1996 – 266,490,000<br />
Total C&D <strong>Waste</strong> generated in 1996 = 104.08 MMT<br />
134