Mmushi T MSc (Microbiology).pdf
Mmushi T MSc (Microbiology).pdf
Mmushi T MSc (Microbiology).pdf

Create successful ePaper yourself
Turn your PDF publications into a flip-book with our unique Google optimized e-Paper software.
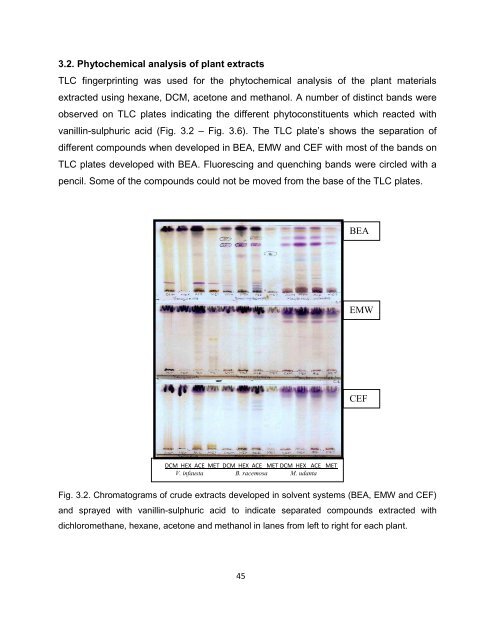
3.2. Phytochemical analysis of plant extracts<br />
TLC fingerprinting was used for the phytochemical analysis of the plant materials<br />
extracted using hexane, DCM, acetone and methanol. A number of distinct bands were<br />
observed on TLC plates indicating the different phytoconstituents which reacted with<br />
vanillin-sulphuric acid (Fig. 3.2 – Fig. 3.6). The TLC plate’s shows the separation of<br />
different compounds when developed in BEA, EMW and CEF with most of the bands on<br />
TLC plates developed with BEA. Fluorescing and quenching bands were circled with a<br />
pencil. Some of the compounds could not be moved from the base of the TLC plates.<br />
BEA<br />
EMW<br />
CEF<br />
DCM HEX ACE MET DCM HEX ACE MET DCM HEX ACE MET<br />
V. infausta B. racemosa M. udanta<br />
Fig. 3.2. Chromatograms of crude extracts developed in solvent systems (BEA, EMW and CEF)<br />
and sprayed with vanillin-sulphuric acid to indicate separated compounds extracted with<br />
dichloromethane, hexane, acetone and methanol in lanes from left to right for each plant.<br />
45