

Download the report (150 p.) - KCE
Download the report (150 p.) - KCE
Download the report (150 p.) - KCE

You also want an ePaper? Increase the reach of your titles
YUMPU automatically turns print PDFs into web optimized ePapers that Google loves.
12 Making General Practice Attractive: Encouraging GP attraction and Retention <strong>KCE</strong> Reports 90<br />
1.4.1.6 Inactivity in <strong>the</strong> curative sector for <strong>the</strong> licensed GPs: annual growth rates by<br />
linguistic community (INAMI/RIZIV database)<br />
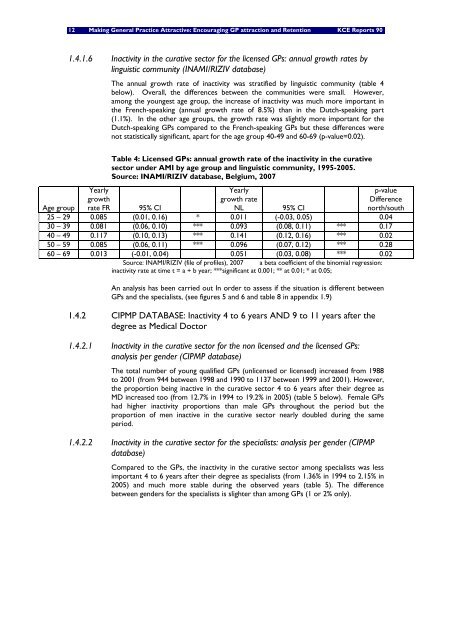
The annual growth rate of inactivity was stratified by linguistic community (table 4<br />
below). Overall, <strong>the</strong> differences between <strong>the</strong> communities were small. However,<br />
among <strong>the</strong> youngest age group, <strong>the</strong> increase of inactivity was much more important in<br />
<strong>the</strong> French-speaking (annual growth rate of 8.5%) than in <strong>the</strong> Dutch-speaking part<br />
(1.1%). In <strong>the</strong> o<strong>the</strong>r age groups, <strong>the</strong> growth rate was slightly more important for <strong>the</strong><br />
Dutch-speaking GPs compared to <strong>the</strong> French-speaking GPs but <strong>the</strong>se differences were<br />
not statistically significant, apart for <strong>the</strong> age group 40-49 and 60-69 (p-value=0.02).<br />
Yearly<br />
growth<br />
rate FR<br />
Table 4: Licensed GPs: annual growth rate of <strong>the</strong> inactivity in <strong>the</strong> curative<br />
sector under AMI by age group and linguistic community, 1995-2005.<br />
Source: INAMI/RIZIV database, Belgium, 2007<br />
Yearly<br />
growth rate<br />
NL<br />
p-value<br />
Difference<br />
north/south<br />
Age group<br />
95% CI<br />
95% CI<br />
25 – 29 0.085 (0.01, 0.16) * 0.011 (-0.03, 0.05) 0.04<br />
30 – 39 0.081 (0.06, 0.10) *** 0.093 (0.08, 0.11) *** 0.17<br />
40 – 49 0.117 (0.10, 0.13) *** 0.141 (0.12, 0.16) *** 0.02<br />
50 – 59 0.085 (0.06, 0.11) *** 0.096 (0.07, 0.12) *** 0.28<br />
60 – 69 0.013 (-0.01, 0.04) 0.051 (0.03, 0.08) *** 0.02<br />
Source: INAMI/RIZIV (file of profiles), 2007 a beta coefficient of <strong>the</strong> binomial regression:<br />
inactivity rate at time t = a + b year; ***significant at 0.001; ** at 0.01; * at 0.05;<br />
An analysis has been carried out In order to assess if <strong>the</strong> situation is different between<br />
GPs and <strong>the</strong> specialists, (see figures 5 and 6 and table 8 in appendix 1.9)<br />
1.4.2 CIPMP DATABASE: Inactivity 4 to 6 years AND 9 to 11 years after <strong>the</strong><br />
degree as Medical Doctor<br />
1.4.2.1 Inactivity in <strong>the</strong> curative sector for <strong>the</strong> non licensed and <strong>the</strong> licensed GPs:<br />
analysis per gender (CIPMP database)<br />
The total number of young qualified GPs (unlicensed or licensed) increased from 1988<br />
to 2001 (from 944 between 1998 and 1990 to 1137 between 1999 and 2001). However,<br />
<strong>the</strong> proportion being inactive in <strong>the</strong> curative sector 4 to 6 years after <strong>the</strong>ir degree as<br />
MD increased too (from 12.7% in 1994 to 19.2% in 2005) (table 5 below). Female GPs<br />
had higher inactivity proportions than male GPs throughout <strong>the</strong> period but <strong>the</strong><br />
proportion of men inactive in <strong>the</strong> curative sector nearly doubled during <strong>the</strong> same<br />
period.<br />
1.4.2.2 Inactivity in <strong>the</strong> curative sector for <strong>the</strong> specialists: analysis per gender (CIPMP<br />
database)<br />
Compared to <strong>the</strong> GPs, <strong>the</strong> inactivity in <strong>the</strong> curative sector among specialists was less<br />
important 4 to 6 years after <strong>the</strong>ir degree as specialists (from 1.36% in 1994 to 2.15% in<br />
2005) and much more stable during <strong>the</strong> observed years (table 5). The difference<br />
between genders for <strong>the</strong> specialists is slighter than among GPs (1 or 2% only).


