

Chapter 7 Rational Functions - College of the Redwoods
Chapter 7 Rational Functions - College of the Redwoods
Chapter 7 Rational Functions - College of the Redwoods

Create successful ePaper yourself
Turn your PDF publications into a flip-book with our unique Google optimized e-Paper software.
Section 7.7 Solving <strong>Rational</strong> Equations 715<br />
Solve <strong>the</strong> equation f(x) = 2 for x using both graphical and analytical techniques, <strong>the</strong>n<br />
compare solutions. Perform each <strong>of</strong> <strong>the</strong> following tasks.<br />
a. Sketch <strong>the</strong> graph <strong>of</strong> f on graph paper. Label <strong>the</strong> zeros <strong>of</strong> f with <strong>the</strong>ir coordinates<br />
and <strong>the</strong> asymptotes <strong>of</strong> f with <strong>the</strong>ir equations.<br />
b. Add <strong>the</strong> graph <strong>of</strong> y = 2 to your plot and estimate <strong>the</strong> coordinates <strong>of</strong> where <strong>the</strong><br />
graph <strong>of</strong> f intersects <strong>the</strong> graph <strong>of</strong> y = 2.<br />
c. Use <strong>the</strong> intersect utility on your calculator to find better approximations <strong>of</strong> <strong>the</strong><br />
points where <strong>the</strong> graphs <strong>of</strong> f and y = 2 intersect.<br />
d. Solve <strong>the</strong> equation f(x) = 2 algebraically and compare your solutions to those found<br />
in part (c).<br />
For <strong>the</strong> graph in part (a), we need to find <strong>the</strong> zeros <strong>of</strong> f and <strong>the</strong> equations <strong>of</strong> any<br />
vertical or horizontal asymptotes.<br />
To find <strong>the</strong> zero <strong>of</strong> <strong>the</strong> function f, we find a common denominator and add <strong>the</strong> two<br />
rational expressions in equation (8).<br />
f(x) = 1 x + 1<br />
x − 4 = x − 4<br />
x(x − 4) + x<br />
x(x − 4) = 2x − 4<br />
x(x − 4)<br />
Note that <strong>the</strong> numerator <strong>of</strong> this result equal zero (but not <strong>the</strong> denominator) when<br />
x = 2. This is <strong>the</strong> zero <strong>of</strong> f. Thus, <strong>the</strong> graph <strong>of</strong> f has x-intercept at (2, 0), as shown<br />
in Figure 4.<br />
Note that <strong>the</strong> rational function in equation (9) is reduced to lowest terms. The<br />
denominators <strong>of</strong> x and x + 4 in equation (9) are zero when x = 0 and x = 4. These<br />
are our vertical asymptotes, as shown in Figure 4.<br />
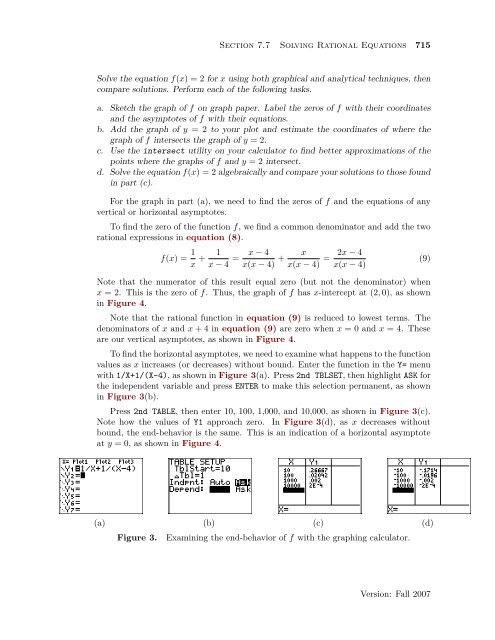
To find <strong>the</strong> horizontal asymptotes, we need to examine what happens to <strong>the</strong> function<br />
values as x increases (or decreases) without bound. Enter <strong>the</strong> function in <strong>the</strong> Y= menu<br />
with 1/X+1/(X-4), as shown in Figure 3(a). Press 2nd TBLSET, <strong>the</strong>n highlight ASK for<br />
<strong>the</strong> independent variable and press ENTER to make this selection permanent, as shown<br />
in Figure 3(b).<br />
Press 2nd TABLE, <strong>the</strong>n enter 10, 100, 1,000, and 10,000, as shown in Figure 3(c).<br />
Note how <strong>the</strong> values <strong>of</strong> Y1 approach zero. In Figure 3(d), as x decreases without<br />
bound, <strong>the</strong> end-behavior is <strong>the</strong> same. This is an indication <strong>of</strong> a horizontal asymptote<br />
at y = 0, as shown in Figure 4.<br />
(9)<br />
(a) (b) (c) (d)<br />
Figure 3.<br />
Examining <strong>the</strong> end-behavior <strong>of</strong> f with <strong>the</strong> graphing calculator.<br />
Version: Fall 2007


