

Chapter 7 Rational Functions - College of the Redwoods
Chapter 7 Rational Functions - College of the Redwoods
Chapter 7 Rational Functions - College of the Redwoods

You also want an ePaper? Increase the reach of your titles
YUMPU automatically turns print PDFs into web optimized ePapers that Google loves.
606 <strong>Chapter</strong> 7 <strong>Rational</strong> <strong>Functions</strong><br />
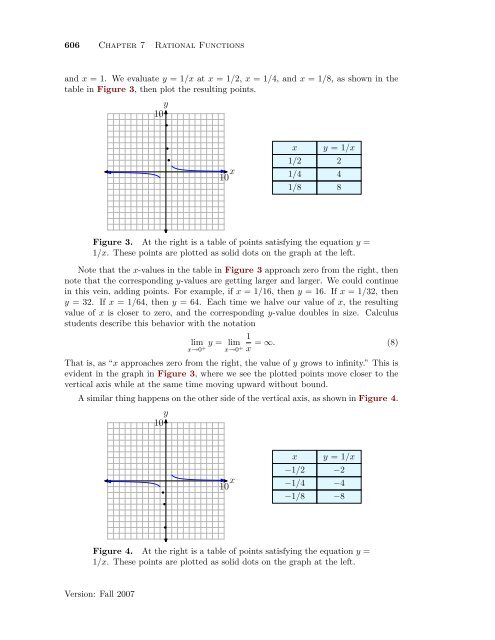
and x = 1. We evaluate y = 1/x at x = 1/2, x = 1/4, and x = 1/8, as shown in <strong>the</strong><br />
table in Figure 3, <strong>the</strong>n plot <strong>the</strong> resulting points.<br />
y<br />
10<br />
x<br />
10<br />
x y = 1/x<br />
1/2 2<br />
1/4 4<br />
1/8 8<br />
Figure 3. At <strong>the</strong> right is a table <strong>of</strong> points satisfying <strong>the</strong> equation y =<br />
1/x. These points are plotted as solid dots on <strong>the</strong> graph at <strong>the</strong> left.<br />
Note that <strong>the</strong> x-values in <strong>the</strong> table in Figure 3 approach zero from <strong>the</strong> right, <strong>the</strong>n<br />
note that <strong>the</strong> corresponding y-values are getting larger and larger. We could continue<br />
in this vein, adding points. For example, if x = 1/16, <strong>the</strong>n y = 16. If x = 1/32, <strong>the</strong>n<br />
y = 32. If x = 1/64, <strong>the</strong>n y = 64. Each time we halve our value <strong>of</strong> x, <strong>the</strong> resulting<br />
value <strong>of</strong> x is closer to zero, and <strong>the</strong> corresponding y-value doubles in size. Calculus<br />
students describe this behavior with <strong>the</strong> notation<br />
lim y = lim 1<br />
= ∞. (8)<br />
x→0 + x→0 + x<br />
That is, as “x approaches zero from <strong>the</strong> right, <strong>the</strong> value <strong>of</strong> y grows to infinity.” This is<br />
evident in <strong>the</strong> graph in Figure 3, where we see <strong>the</strong> plotted points move closer to <strong>the</strong><br />
vertical axis while at <strong>the</strong> same time moving upward without bound.<br />
A similar thing happens on <strong>the</strong> o<strong>the</strong>r side <strong>of</strong> <strong>the</strong> vertical axis, as shown in Figure 4.<br />
y<br />
10<br />
x<br />
10<br />
x y = 1/x<br />
−1/2 −2<br />
−1/4 −4<br />
−1/8 −8<br />
Figure 4. At <strong>the</strong> right is a table <strong>of</strong> points satisfying <strong>the</strong> equation y =<br />
1/x. These points are plotted as solid dots on <strong>the</strong> graph at <strong>the</strong> left.<br />
Version: Fall 2007


