

Chapter 7 Rational Functions - College of the Redwoods
Chapter 7 Rational Functions - College of the Redwoods
Chapter 7 Rational Functions - College of the Redwoods

Create successful ePaper yourself
Turn your PDF publications into a flip-book with our unique Google optimized e-Paper software.
612 <strong>Chapter</strong> 7 <strong>Rational</strong> <strong>Functions</strong><br />
line” drawn from <strong>the</strong> top <strong>of</strong> <strong>the</strong> screen to <strong>the</strong> bottom, attempting to “connect” <strong>the</strong> two<br />
branches <strong>of</strong> <strong>the</strong> hyperbola.<br />
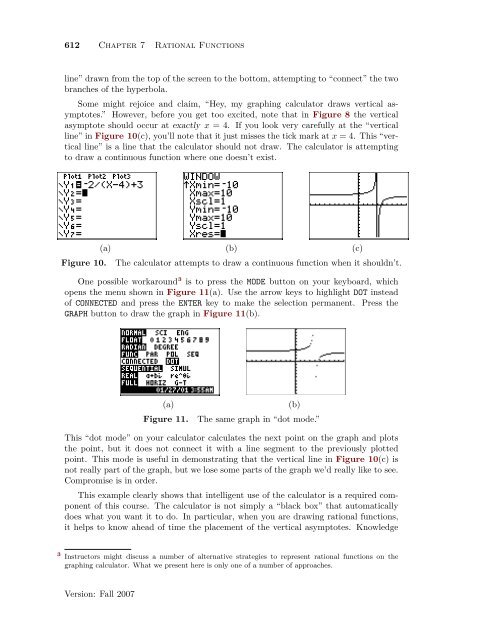
Some might rejoice and claim, “Hey, my graphing calculator draws vertical asymptotes.”<br />
However, before you get too excited, note that in Figure 8 <strong>the</strong> vertical<br />
asymptote should occur at exactly x = 4. If you look very carefully at <strong>the</strong> “vertical<br />
line” in Figure 10(c), you’ll note that it just misses <strong>the</strong> tick mark at x = 4. This “vertical<br />
line” is a line that <strong>the</strong> calculator should not draw. The calculator is attempting<br />
to draw a continuous function where one doesn’t exist.<br />
Figure 10.<br />
(a) (b) (c)<br />
The calculator attempts to draw a continuous function when it shouldn’t.<br />
One possible workaround 3 is to press <strong>the</strong> MODE button on your keyboard, which<br />
opens <strong>the</strong> menu shown in Figure 11(a). Use <strong>the</strong> arrow keys to highlight DOT instead<br />
<strong>of</strong> CONNECTED and press <strong>the</strong> ENTER key to make <strong>the</strong> selection permanent. Press <strong>the</strong><br />
GRAPH button to draw <strong>the</strong> graph in Figure 11(b).<br />
(a)<br />
Figure 11.<br />
(b)<br />
The same graph in “dot mode.”<br />
This “dot mode” on your calculator calculates <strong>the</strong> next point on <strong>the</strong> graph and plots<br />
<strong>the</strong> point, but it does not connect it with a line segment to <strong>the</strong> previously plotted<br />
point. This mode is useful in demonstrating that <strong>the</strong> vertical line in Figure 10(c) is<br />
not really part <strong>of</strong> <strong>the</strong> graph, but we lose some parts <strong>of</strong> <strong>the</strong> graph we’d really like to see.<br />
Compromise is in order.<br />
This example clearly shows that intelligent use <strong>of</strong> <strong>the</strong> calculator is a required component<br />
<strong>of</strong> this course. The calculator is not simply a “black box” that automatically<br />
does what you want it to do. In particular, when you are drawing rational functions,<br />
it helps to know ahead <strong>of</strong> time <strong>the</strong> placement <strong>of</strong> <strong>the</strong> vertical asymptotes. Knowledge<br />
3 Instructors might discuss a number <strong>of</strong> alternative strategies to represent rational functions on <strong>the</strong><br />
graphing calculator. What we present here is only one <strong>of</strong> a number <strong>of</strong> approaches.<br />
Version: Fall 2007


