

Chapter 7 Rational Functions - College of the Redwoods
Chapter 7 Rational Functions - College of the Redwoods
Chapter 7 Rational Functions - College of the Redwoods

Create successful ePaper yourself
Turn your PDF publications into a flip-book with our unique Google optimized e-Paper software.
Section 7.1 Introducing <strong>Rational</strong> <strong>Functions</strong> 605<br />
They say “<strong>the</strong> limit <strong>of</strong> y as x approaches infinity is zero.” That is, as x approaches<br />
infinity, y approaches zero.<br />
x y = 1/x<br />
100 0.01<br />
1 000 0.001<br />
10 000 0.0001<br />
Table 1.<br />
(a)<br />
x y = 1/x<br />
−100 −0.01<br />
−1 000 −0.001<br />
−10 000 −0.0001<br />
(b)<br />
Examining <strong>the</strong> end-behavior <strong>of</strong> y = 1/x.<br />
A completely similar event happens at <strong>the</strong> left end. As x decreases without bound,<br />
that is, as x decreases toward −∞, note that <strong>the</strong> y-values in Table 1(b) are all negative<br />
and approach zero. Calculus students have a similar notation for this idea.<br />
lim y = lim 1<br />
= 0. (7)<br />
x→−∞ x→−∞ x<br />
They say “<strong>the</strong> limit <strong>of</strong> y as x approaches negative infinity is zero.”<br />
approaches negative infinity, y approaches zero.<br />
That is, as x<br />
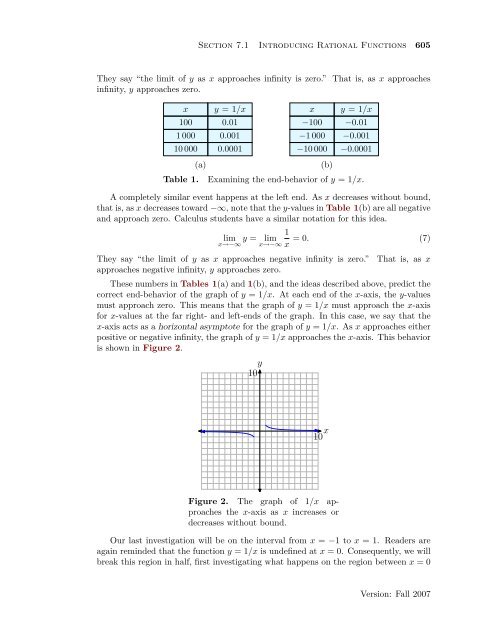
These numbers in Tables 1(a) and 1(b), and <strong>the</strong> ideas described above, predict <strong>the</strong><br />
correct end-behavior <strong>of</strong> <strong>the</strong> graph <strong>of</strong> y = 1/x. At each end <strong>of</strong> <strong>the</strong> x-axis, <strong>the</strong> y-values<br />
must approach zero. This means that <strong>the</strong> graph <strong>of</strong> y = 1/x must approach <strong>the</strong> x-axis<br />
for x-values at <strong>the</strong> far right- and left-ends <strong>of</strong> <strong>the</strong> graph. In this case, we say that <strong>the</strong><br />
x-axis acts as a horizontal asymptote for <strong>the</strong> graph <strong>of</strong> y = 1/x. As x approaches ei<strong>the</strong>r<br />
positive or negative infinity, <strong>the</strong> graph <strong>of</strong> y = 1/x approaches <strong>the</strong> x-axis. This behavior<br />
is shown in Figure 2.<br />
y<br />
10<br />
x<br />
10<br />
Figure 2. The graph <strong>of</strong> 1/x approaches<br />
<strong>the</strong> x-axis as x increases or<br />
decreases without bound.<br />
Our last investigation will be on <strong>the</strong> interval from x = −1 to x = 1. Readers are<br />
again reminded that <strong>the</strong> function y = 1/x is undefined at x = 0. Consequently, we will<br />
break this region in half, first investigating what happens on <strong>the</strong> region between x = 0<br />
Version: Fall 2007


