

Chapter 7 Rational Functions - College of the Redwoods
Chapter 7 Rational Functions - College of the Redwoods
Chapter 7 Rational Functions - College of the Redwoods

You also want an ePaper? Increase the reach of your titles
YUMPU automatically turns print PDFs into web optimized ePapers that Google loves.
604 <strong>Chapter</strong> 7 <strong>Rational</strong> <strong>Functions</strong><br />
An important skill to develop is <strong>the</strong> ability to draw <strong>the</strong> graph <strong>of</strong> a rational function.<br />
Let’s begin by drawing <strong>the</strong> graph <strong>of</strong> one <strong>of</strong> <strong>the</strong> simplest (but most fundamental) rational<br />
functions.<br />
The Graph <strong>of</strong> y = 1/x<br />
In all new situations, when we are presented with an equation whose graph we’ve not<br />
considered or do not recognize, we begin <strong>the</strong> process <strong>of</strong> drawing <strong>the</strong> graph by creating<br />
a table <strong>of</strong> points that satisfy <strong>the</strong> equation. It’s important to remember that <strong>the</strong> graph<br />
<strong>of</strong> an equation is <strong>the</strong> set <strong>of</strong> all points that satisfy <strong>the</strong> equation. We note that zero is<br />
not in <strong>the</strong> domain <strong>of</strong> y = 1/x (division by zero makes no sense and is not defined), and<br />
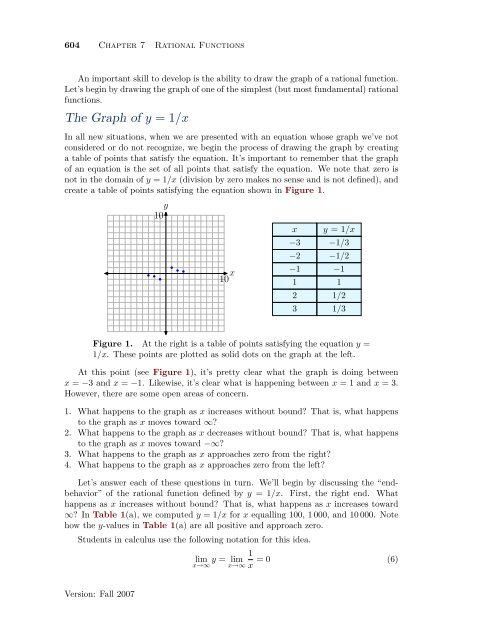
create a table <strong>of</strong> points satisfying <strong>the</strong> equation shown in Figure 1.<br />
y<br />
10<br />
x<br />
10<br />
x y = 1/x<br />
−3 −1/3<br />
−2 −1/2<br />
−1<br />
−1<br />
1 1<br />
2 1/2<br />
3 1/3<br />
Figure 1. At <strong>the</strong> right is a table <strong>of</strong> points satisfying <strong>the</strong> equation y =<br />
1/x. These points are plotted as solid dots on <strong>the</strong> graph at <strong>the</strong> left.<br />
At this point (see Figure 1), it’s pretty clear what <strong>the</strong> graph is doing between<br />
x = −3 and x = −1. Likewise, it’s clear what is happening between x = 1 and x = 3.<br />
However, <strong>the</strong>re are some open areas <strong>of</strong> concern.<br />
1. What happens to <strong>the</strong> graph as x increases without bound? That is, what happens<br />
to <strong>the</strong> graph as x moves toward ∞?<br />
2. What happens to <strong>the</strong> graph as x decreases without bound? That is, what happens<br />
to <strong>the</strong> graph as x moves toward −∞?<br />
3. What happens to <strong>the</strong> graph as x approaches zero from <strong>the</strong> right?<br />
4. What happens to <strong>the</strong> graph as x approaches zero from <strong>the</strong> left?<br />
Let’s answer each <strong>of</strong> <strong>the</strong>se questions in turn. We’ll begin by discussing <strong>the</strong> “endbehavior”<br />
<strong>of</strong> <strong>the</strong> rational function defined by y = 1/x. First, <strong>the</strong> right end. What<br />
happens as x increases without bound? That is, what happens as x increases toward<br />
∞? In Table 1(a), we computed y = 1/x for x equalling 100, 1 000, and 10 000. Note<br />
how <strong>the</strong> y-values in Table 1(a) are all positive and approach zero.<br />
Students in calculus use <strong>the</strong> following notation for this idea.<br />
lim<br />
x→∞ y = lim<br />
x→∞<br />
1<br />
x = 0 (6)<br />
Version: Fall 2007


