

Chapter 7 Rational Functions - College of the Redwoods
Chapter 7 Rational Functions - College of the Redwoods
Chapter 7 Rational Functions - College of the Redwoods

You also want an ePaper? Increase the reach of your titles
YUMPU automatically turns print PDFs into web optimized ePapers that Google loves.
650 <strong>Chapter</strong> 7 <strong>Rational</strong> <strong>Functions</strong><br />
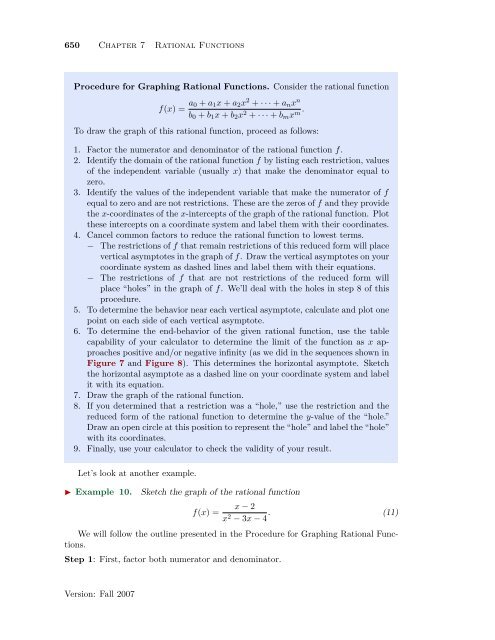
Procedure for Graphing <strong>Rational</strong> <strong>Functions</strong>. Consider <strong>the</strong> rational function<br />
f(x) = a 0 + a 1 x + a 2 x 2 + · · · + a n x n<br />
b 0 + b 1 x + b 2 x 2 + · · · + b m x m .<br />
To draw <strong>the</strong> graph <strong>of</strong> this rational function, proceed as follows:<br />
1. Factor <strong>the</strong> numerator and denominator <strong>of</strong> <strong>the</strong> rational function f.<br />
2. Identify <strong>the</strong> domain <strong>of</strong> <strong>the</strong> rational function f by listing each restriction, values<br />
<strong>of</strong> <strong>the</strong> independent variable (usually x) that make <strong>the</strong> denominator equal to<br />
zero.<br />
3. Identify <strong>the</strong> values <strong>of</strong> <strong>the</strong> independent variable that make <strong>the</strong> numerator <strong>of</strong> f<br />
equal to zero and are not restrictions. These are <strong>the</strong> zeros <strong>of</strong> f and <strong>the</strong>y provide<br />
<strong>the</strong> x-coordinates <strong>of</strong> <strong>the</strong> x-intercepts <strong>of</strong> <strong>the</strong> graph <strong>of</strong> <strong>the</strong> rational function. Plot<br />
<strong>the</strong>se intercepts on a coordinate system and label <strong>the</strong>m with <strong>the</strong>ir coordinates.<br />
4. Cancel common factors to reduce <strong>the</strong> rational function to lowest terms.<br />
− The restrictions <strong>of</strong> f that remain restrictions <strong>of</strong> this reduced form will place<br />
vertical asymptotes in <strong>the</strong> graph <strong>of</strong> f. Draw <strong>the</strong> vertical asymptotes on your<br />
coordinate system as dashed lines and label <strong>the</strong>m with <strong>the</strong>ir equations.<br />
− The restrictions <strong>of</strong> f that are not restrictions <strong>of</strong> <strong>the</strong> reduced form will<br />
place “holes” in <strong>the</strong> graph <strong>of</strong> f. We’ll deal with <strong>the</strong> holes in step 8 <strong>of</strong> this<br />
procedure.<br />
5. To determine <strong>the</strong> behavior near each vertical asymptote, calculate and plot one<br />
point on each side <strong>of</strong> each vertical asymptote.<br />
6. To determine <strong>the</strong> end-behavior <strong>of</strong> <strong>the</strong> given rational function, use <strong>the</strong> table<br />
capability <strong>of</strong> your calculator to determine <strong>the</strong> limit <strong>of</strong> <strong>the</strong> function as x approaches<br />
positive and/or negative infinity (as we did in <strong>the</strong> sequences shown in<br />
Figure 7 and Figure 8). This determines <strong>the</strong> horizontal asymptote. Sketch<br />
<strong>the</strong> horizontal asymptote as a dashed line on your coordinate system and label<br />
it with its equation.<br />
7. Draw <strong>the</strong> graph <strong>of</strong> <strong>the</strong> rational function.<br />
8. If you determined that a restriction was a “hole,” use <strong>the</strong> restriction and <strong>the</strong><br />
reduced form <strong>of</strong> <strong>the</strong> rational function to determine <strong>the</strong> y-value <strong>of</strong> <strong>the</strong> “hole.”<br />
Draw an open circle at this position to represent <strong>the</strong> “hole” and label <strong>the</strong> “hole”<br />
with its coordinates.<br />
9. Finally, use your calculator to check <strong>the</strong> validity <strong>of</strong> your result.<br />
Let’s look at ano<strong>the</strong>r example.<br />
◮ Example 10.<br />
Sketch <strong>the</strong> graph <strong>of</strong> <strong>the</strong> rational function<br />
f(x) =<br />
x − 2<br />
x 2 − 3x − 4 . (11)<br />
We will follow <strong>the</strong> outline presented in <strong>the</strong> Procedure for Graphing <strong>Rational</strong> <strong>Functions</strong>.<br />
Step 1: First, factor both numerator and denominator.<br />
Version: Fall 2007


