Numerical Methods Course Notes Version 0.1 (UCSD Math 174, Fall ...
Numerical Methods Course Notes Version 0.1 (UCSD Math 174, Fall ...
Numerical Methods Course Notes Version 0.1 (UCSD Math 174, Fall ...

You also want an ePaper? Increase the reach of your titles
YUMPU automatically turns print PDFs into web optimized ePapers that Google loves.
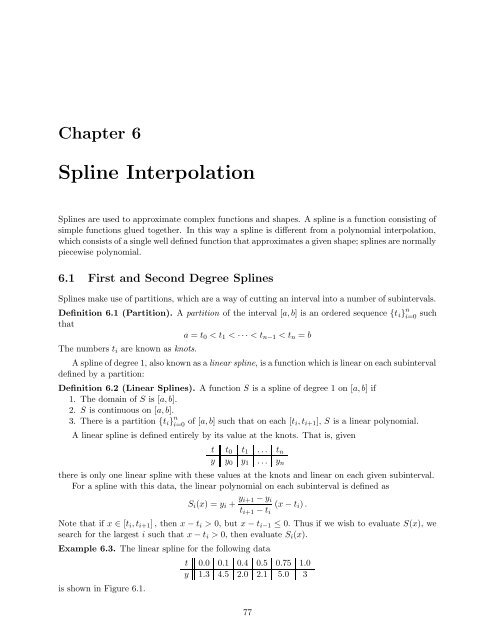
Chapter 6<br />
Spline Interpolation<br />
Splines are used to approximate complex functions and shapes. A spline is a function consisting of<br />
simple functions glued together. In this way a spline is different from a polynomial interpolation,<br />
which consists of a single well defined function that approximates a given shape; splines are normally<br />
piecewise polynomial.<br />
6.1 First and Second Degree Splines<br />
Splines make use of partitions, which are a way of cutting an interval into a number of subintervals.<br />
Definition 6.1 (Partition). A partition of the interval [a, b] is an ordered sequence {t i } n i=0 such<br />
that<br />
a = t 0 < t 1 < · · · < t n−1 < t n = b<br />
The numbers t i are known as knots.<br />
A spline of degree 1, also known as a linear spline, is a function which is linear on each subinterval<br />
defined by a partition:<br />
Definition 6.2 (Linear Splines). A function S is a spline of degree 1 on [a, b] if<br />
1. The domain of S is [a, b].<br />
2. S is continuous on [a, b].<br />
3. There is a partition {t i } n i=0 of [a, b] such that on each [t i, t i+1 ], S is a linear polynomial.<br />
A linear spline is defined entirely by its value at the knots. That is, given<br />
t t 0 t 1 . . . t n<br />
y y 0 y 1 . . . y n<br />
there is only one linear spline with these values at the knots and linear on each given subinterval.<br />
For a spline with this data, the linear polynomial on each subinterval is defined as<br />
S i (x) = y i + y i+1 − y i<br />
t i+1 − t i<br />
(x − t i ) .<br />
Note that if x ∈ [t i , t i+1 ] , then x − t i > 0, but x − t i−1 ≤ 0. Thus if we wish to evaluate S(x), we<br />
search for the largest i such that x − t i > 0, then evaluate S i (x).<br />
Example 6.3. The linear spline for the following data<br />
is shown in Figure 6.1.<br />
t 0.0 <strong>0.1</strong> 0.4 0.5 0.75 1.0<br />
y 1.3 4.5 2.0 2.1 5.0 3<br />
77