

Neil D. Burgess, Paul Harrison, Peter Sumbi, James Laizer, Adam ...
Neil D. Burgess, Paul Harrison, Peter Sumbi, James Laizer, Adam ...
Neil D. Burgess, Paul Harrison, Peter Sumbi, James Laizer, Adam ...

Create successful ePaper yourself
Turn your PDF publications into a flip-book with our unique Google optimized e-Paper software.
ANNEXES: TANZANIA’S COASTAL FORESTS 2011<br />
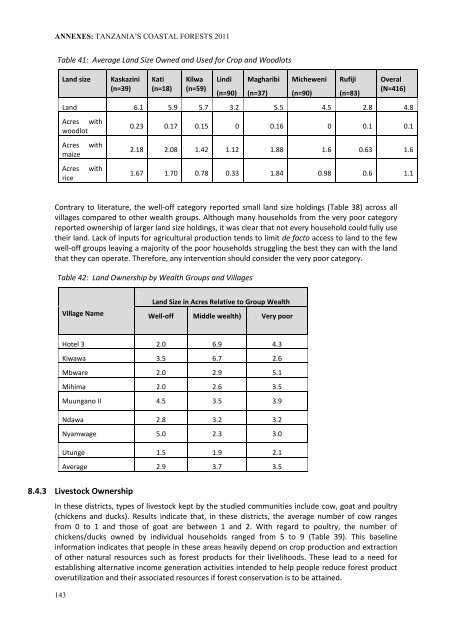
Table 41: Average Land Size Owned and Used for Crop and Woodlots<br />
Land size<br />
Kaskazini<br />
(n=39)<br />
Kati<br />
(n=18)<br />
Kilwa<br />
(n=59)<br />
Lindi<br />
(n=90)<br />
Magharibi<br />
(n=37)<br />
Micheweni<br />
(n=90)<br />
Rufiji<br />
(n=83)<br />
Overal<br />
(N=416)<br />
Land 6.1 5.9 5.7 3.2 5.5 4.5 2.8 4.8<br />
Acres with<br />
woodlot<br />
Acres<br />
maize<br />
Acres<br />
rice<br />
with<br />
with<br />
0.23 0.17 0.15 0 0.16 0 0.1 0.1<br />
2.18 2.08 1.42 1.12 1.88 1.6 0.63 1.6<br />
1.67 1.70 0.78 0.33 1.84 0.98 0.6 1.1<br />
Contrary to literature, the well-off category reported small land size holdings (Table 38) across all<br />
villages compared to other wealth groups. Although many households from the very poor category<br />
reported ownership of larger land size holdings, it was clear that not every household could fully use<br />
their land. Lack of inputs for agricultural production tends to limit de facto access to land to the few<br />
well-off groups leaving a majority of the poor households struggling the best they can with the land<br />
that they can operate. Therefore, any intervention should consider the very poor category.<br />
Table 42: Land Ownership by Wealth Groups and Villages<br />
Village Name<br />
Land Size in Acres Relative to Group Wealth<br />
Well-off Middle wealth) Very poor<br />
Hotel 3 2.0 6.9 4.3<br />
Kiwawa 3.5 6.7 2.6<br />
Mbware 2.0 2.9 5.1<br />
Mihima 2.0 2.6 3.5<br />
Muungano II 4.5 3.5 3.9<br />
Ndawa 2.8 3.2 3.2<br />
Nyamwage 5.0 2.3 3.0<br />
Utunge 1.5 1.9 2.1<br />
Average 2.9 3.7 3.5<br />
8.4.3 Livestock Ownership<br />
In these districts, types of livestock kept by the studied communities include cow, goat and poultry<br />
(chickens and ducks). Results indicate that, in these districts, the average number of cow ranges<br />
from 0 to 1 and those of goat are between 1 and 2. With regard to poultry, the number of<br />
chickens/ducks owned by individual households ranged from 5 to 9 (Table 39). This baseline<br />
information indicates that people in these areas heavily depend on crop production and extraction<br />
of other natural resources such as forest products for their livelihoods. These lead to a need for<br />
establishing alternative income generation activities intended to help people reduce forest product<br />
overutilization and their associated resources if forest conservation is to be attained.<br />
143


