

Neil D. Burgess, Paul Harrison, Peter Sumbi, James Laizer, Adam ...
Neil D. Burgess, Paul Harrison, Peter Sumbi, James Laizer, Adam ...
Neil D. Burgess, Paul Harrison, Peter Sumbi, James Laizer, Adam ...

Create successful ePaper yourself
Turn your PDF publications into a flip-book with our unique Google optimized e-Paper software.
BIODIVERSITY BASELINE: TANZANIA’S COASTAL FORESTS 2011<br />
2.6 Implications for Carbon Emissions<br />
The forest status and change analysis of Godoy et al. (2011) has also been turned into an assessment of<br />
carbon stock and change. The carbon data used was from an African wide map of above ground carbon<br />
developed by Baccini et al. (2008). Carbon content was assumed to be 50 % of dry weight. Average<br />
carbon stock for above- and below-ground biomass was calculated for each district based on the<br />
forested area in 2000. The map of carbon stocks was combined with that of forest-loss data for 1990–<br />
2000 and 2000–2007 to estimate gross carbon emissions during each period. It was assumed that all<br />
carbon content was released into the atmosphere once the vegetation was cleared.<br />
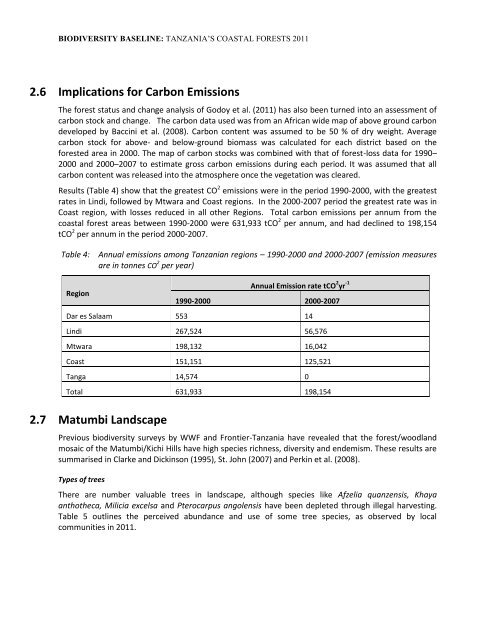
Results (Table 4) show that the greatest CO 2 emissions were in the period 1990-2000, with the greatest<br />
rates in Lindi, followed by Mtwara and Coast regions. In the 2000-2007 period the greatest rate was in<br />
Coast region, with losses reduced in all other Regions. Total carbon emissions per annum from the<br />
coastal forest areas between 1990-2000 were 631,933 tCO 2 per annum, and had declined to 198,154<br />
tCO 2 per annum in the period 2000-2007.<br />
Table 4: Annual emissions among Tanzanian regions – 1990-2000 and 2000-2007 (emission measures<br />
are in tonnes CO 2 per year)<br />
Region<br />
Annual Emission rate tCO 2 yr -1<br />
1990-2000 2000-2007<br />
Dar es Salaam 553 14<br />
Lindi 267,524 56,576<br />
Mtwara 198,132 16,042<br />
Coast 151,151 125,521<br />
Tanga 14,574 0<br />
Total 631,933 198,154<br />
2.7 Matumbi Landscape<br />
Previous biodiversity surveys by WWF and Frontier-Tanzania have revealed that the forest/woodland<br />
mosaic of the Matumbi/Kichi Hills have high species richness, diversity and endemism. These results are<br />
summarised in Clarke and Dickinson (1995), St. John (2007) and Perkin et al. (2008).<br />
Types of trees<br />
There are number valuable trees in landscape, although species like Afzelia quanzensis, Khaya<br />
anthotheca, Milicia excelsa and Pterocarpus angolensis have been depleted through illegal harvesting.<br />
Table 5 outlines the perceived abundance and use of some tree species, as observed by local<br />
communities in 2011.


