

Neil D. Burgess, Paul Harrison, Peter Sumbi, James Laizer, Adam ...
Neil D. Burgess, Paul Harrison, Peter Sumbi, James Laizer, Adam ...
Neil D. Burgess, Paul Harrison, Peter Sumbi, James Laizer, Adam ...

You also want an ePaper? Increase the reach of your titles
YUMPU automatically turns print PDFs into web optimized ePapers that Google loves.
ANNEXES: TANZANIA’S COASTAL FORESTS 2011<br />
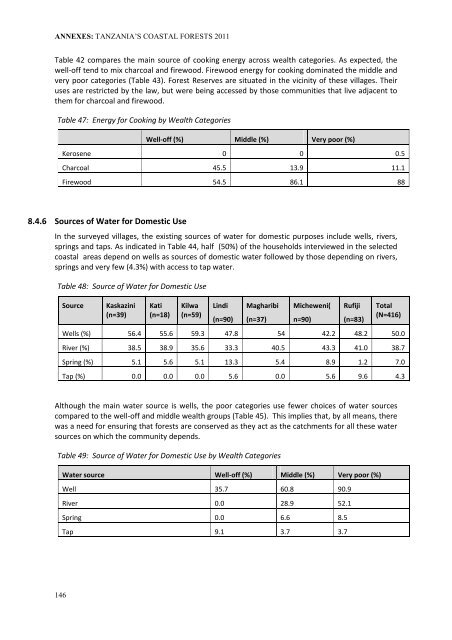
Table 42 compares the main source of cooking energy across wealth categories. As expected, the<br />
well-off tend to mix charcoal and firewood. Firewood energy for cooking dominated the middle and<br />
very poor categories (Table 43). Forest Reserves are situated in the vicinity of these villages. Their<br />
uses are restricted by the law, but were being accessed by those communities that live adjacent to<br />
them for charcoal and firewood.<br />
Table 47: Energy for Cooking by Wealth Categories<br />
Well-off (%) Middle (%) Very poor (%)<br />
Kerosene 0 0 0.5<br />
Charcoal 45.5 13.9 11.1<br />
Firewood 54.5 86.1 88<br />
8.4.6 Sources of Water for Domestic Use<br />
In the surveyed villages, the existing sources of water for domestic purposes include wells, rivers,<br />
springs and taps. As indicated in Table 44, half (50%) of the households interviewed in the selected<br />
coastal areas depend on wells as sources of domestic water followed by those depending on rivers,<br />
springs and very few (4.3%) with access to tap water.<br />
Table 48: Source of Water for Domestic Use<br />
Source<br />
Kaskazini<br />
(n=39)<br />
Kati<br />
(n=18)<br />
Kilwa<br />
(n=59)<br />
Lindi<br />
(n=90)<br />
Magharibi<br />
(n=37)<br />
Micheweni(<br />
n=90)<br />
Rufiji<br />
(n=83)<br />
Total<br />
(N=416)<br />
Wells (%) 56.4 55.6 59.3 47.8 54 42.2 48.2 50.0<br />
River (%) 38.5 38.9 35.6 33.3 40.5 43.3 41.0 38.7<br />
Spring (%) 5.1 5.6 5.1 13.3 5.4 8.9 1.2 7.0<br />
Tap (%) 0.0 0.0 0.0 5.6 0.0 5.6 9.6 4.3<br />
Although the main water source is wells, the poor categories use fewer choices of water sources<br />
compared to the well-off and middle wealth groups (Table 45). This implies that, by all means, there<br />
was a need for ensuring that forests are conserved as they act as the catchments for all these water<br />
sources on which the community depends.<br />
Table 49: Source of Water for Domestic Use by Wealth Categories<br />
Water source Well-off (%) Middle (%) Very poor (%)<br />
Well 35.7 60.8 90.9<br />
River 0.0 28.9 52.1<br />
Spring 0.0 6.6 8.5<br />
Tap 9.1 3.7 3.7<br />
146


