Research 350 - NZ Transport Agency
Research 350 - NZ Transport Agency
Research 350 - NZ Transport Agency

You also want an ePaper? Increase the reach of your titles
YUMPU automatically turns print PDFs into web optimized ePapers that Google loves.
ECONOMIC DEVELOPMENT BENEFITS OF TRANSPORT INVESTMENT<br />
• Kamps (1984) suggests that the ‘supernormal’ returns to public capital cited by<br />
Aschauer may be a result of his use of the production function approach. Vector<br />
autoregressive (VAR) modelling may offer a superior approach to production function<br />
approaches as it allows for feedback effects between output (GDP) and inputs (higher<br />
public capital spending). Past VAR modelling cited by Kamps and his own work<br />
indicates a much weaker long run response to increases in public capital spending<br />
then that cited by Aschauer.<br />
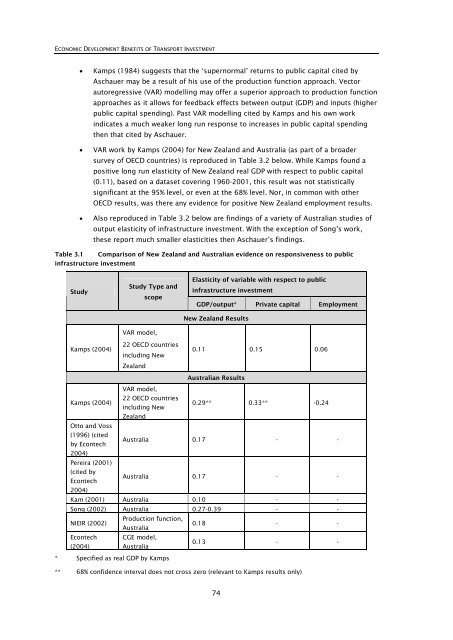
• VAR work by Kamps (2004) for New Zealand and Australia (as part of a broader<br />
survey of OECD countries) is reproduced in Table 3.2 below. While Kamps found a<br />
positive long run elasticity of New Zealand real GDP with respect to public capital<br />
(0.11), based on a dataset covering 1960-2001, this result was not statistically<br />
significant at the 95% level, or even at the 68% level. Nor, in common with other<br />
OECD results, was there any evidence for positive New Zealand employment results.<br />
• Also reproduced in Table 3.2 below are findings of a variety of Australian studies of<br />
output elasticity of infrastructure investment. With the exception of Song’s work,<br />
these report much smaller elasticities then Aschauer’s findings.<br />
Table 3.1 Comparison of New Zealand and Australian evidence on responsiveness to public<br />
infrastructure investment<br />
Study<br />
Kamps (2004)<br />
Study Type and<br />
scope<br />
VAR model,<br />
22 OECD countries<br />
including New<br />
Zealand<br />
Elasticity of variable with respect to public<br />
infrastructure investment<br />
GDP/output* Private capital Employment<br />
New Zealand Results<br />
0.11 0.15 0.06<br />
Australian Results<br />
Kamps (2004)<br />
VAR model,<br />
22 OECD countries<br />
including New<br />
0.29** 0.33** -0.24<br />
Zealand<br />
Otto and Voss<br />
(1996) (cited<br />
by Econtech<br />
Australia 0.17 - -<br />
2004)<br />
Pereira (2001)<br />
(cited by<br />
Econtech<br />
Australia 0.17 - -<br />
2004)<br />
Kam (2001) Australia 0.10 - -<br />
Song (2002) Australia 0.27-0.39 - -<br />
NIEIR (2002)<br />
Production function,<br />
Australia<br />
0.18 - -<br />
Econtech CGE model,<br />
(2004)<br />
Australia<br />
0.13 - -<br />
* Specified as real GDP by Kamps<br />
** 68% confidence interval does not cross zero (relevant to Kamps results only)<br />
74