ERATO Proceedings Istanbul 2006.pdf - Odeon
ERATO Proceedings Istanbul 2006.pdf - Odeon
ERATO Proceedings Istanbul 2006.pdf - Odeon

You also want an ePaper? Increase the reach of your titles
YUMPU automatically turns print PDFs into web optimized ePapers that Google loves.
5.3 The Sound Level<br />
In Figure 6 the strength parameter G is reported vs distance as an average of the middle frequency<br />
bands (500 Hz, 1 kHz and 2 kHz). The graphic is in a semi-logarithmic scale for the distances and<br />
the regression lines are reported together with the free field values. For a better comparison only the<br />
values measured with the source in the orchestra are showed.<br />
In general the G mid values are quite low compared to closed theatres and the trend is constantly<br />
decreasing with a slope close to the free field. In particular RO and HE have a very similar trend,<br />
and are about 5 dB higher than the free field values. The small differences visible at the single<br />
positions are imputable to the different dimensions of the front stage in the two theatres. GE has<br />
lower values probably due to a less efficient reflection from the stage building caused by the<br />
presence of the porch.<br />
6 DISCUSSION<br />
All the results reported above point to the close investigation of the reflection pattern of a typical<br />
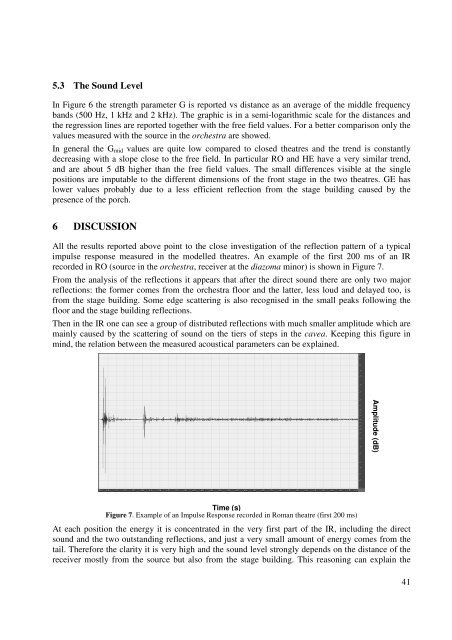
impulse response measured in the modelled theatres. An example of the first 200 ms of an IR<br />
recorded in RO (source in the orchestra, receiver at the diazoma minor) is shown in Figure 7.<br />
From the analysis of the reflections it appears that after the direct sound there are only two major<br />
reflections: the former comes from the orchestra floor and the latter, less loud and delayed too, is<br />
from the stage building. Some edge scattering is also recognised in the small peaks following the<br />
floor and the stage building reflections.<br />
Then in the IR one can see a group of distributed reflections with much smaller amplitude which are<br />
mainly caused by the scattering of sound on the tiers of steps in the cavea. Keeping this figure in<br />
mind, the relation between the measured acoustical parameters can be explained.<br />
Amplitude (dB)<br />
Time (s)<br />
Figure 7. Example of an Impulse Response recorded in Roman theatre (first 200 ms)<br />
At each position the energy it is concentrated in the very first part of the IR, including the direct<br />
sound and the two outstanding reflections, and just a very small amount of energy comes from the<br />
tail. Therefore the clarity it is very high and the sound level strongly depends on the distance of the<br />
receiver mostly from the source but also from the stage building. This reasoning can explain the<br />
41