ERATO Proceedings Istanbul 2006.pdf - Odeon
ERATO Proceedings Istanbul 2006.pdf - Odeon
ERATO Proceedings Istanbul 2006.pdf - Odeon

You also want an ePaper? Increase the reach of your titles
YUMPU automatically turns print PDFs into web optimized ePapers that Google loves.
the sounds, less than 10 points on the 100 points scale. As well, to be musician has no significant<br />
effect on the global judgement on the sounds; however this sub-group has a lower rating than other<br />
participants to the tests, less than 10 points on the 100 points of the full scale.<br />
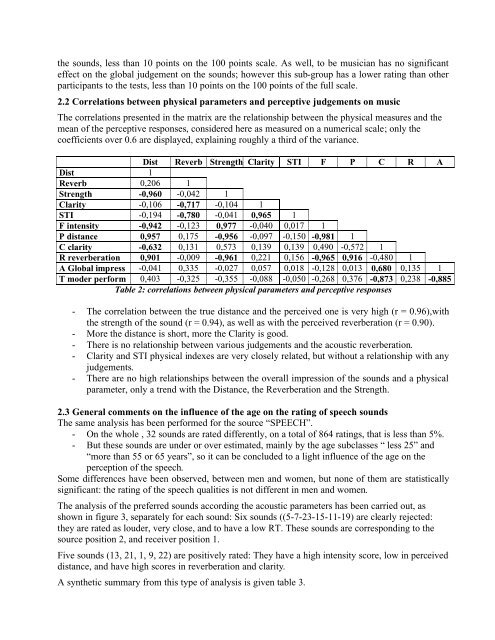
2.2 Correlations between physical parameters and perceptive judgements on music<br />
The correlations presented in the matrix are the relationship between the physical measures and the<br />
mean of the perceptive responses, considered here as measured on a numerical scale; only the<br />
coefficients over 0.6 are displayed, explaining roughly a third of the variance.<br />
Dist Reverb Strength Clarity STI F P C R A<br />
Dist 1<br />
Reverb 0,206 1<br />
Strength -0,960 -0,042 1<br />
Clarity -0,106 -0,717 -0,104 1<br />
STI -0,194 -0,780 -0,041 0,965 1<br />
F intensity -0,942 -0,123 0,977 -0,040 0,017 1<br />
P distance 0,957 0,175 -0,956 -0,097 -0,150 -0,981 1<br />
C clarity -0,632 0,131 0,573 0,139 0,139 0,490 -0,572 1<br />
R reverberation 0,901 -0,009 -0,961 0,221 0,156 -0,965 0,916 -0,480 1<br />
A Global impress -0,041 0,335 -0,027 0,057 0,018 -0,128 0,013 0,680 0,135 1<br />
T moder perform 0,403 -0,325 -0,355 -0,088 -0,050 -0,268 0,376 -0,873 0,238 -0,885<br />
Table 2: correlations between physical parameters and perceptive responses<br />
- The correlation between the true distance and the perceived one is very high (r = 0.96),with<br />
the strength of the sound (r = 0.94), as well as with the perceived reverberation (r = 0.90).<br />
- More the distance is short, more the Clarity is good.<br />
- There is no relationship between various judgements and the acoustic reverberation.<br />
- Clarity and STI physical indexes are very closely related, but without a relationship with any<br />
judgements.<br />
- There are no high relationships between the overall impression of the sounds and a physical<br />
parameter, only a trend with the Distance, the Reverberation and the Strength.<br />
2.3 General comments on the influence of the age on the rating of speech sounds<br />
The same analysis has been performed for the source “SPEECH”.<br />
- On the whole , 32 sounds are rated differently, on a total of 864 ratings, that is less than 5%.<br />
- But these sounds are under or over estimated, mainly by the age subclasses “ less 25” and<br />
“more than 55 or 65 years”, so it can be concluded to a light influence of the age on the<br />
perception of the speech.<br />
Some differences have been observed, between men and women, but none of them are statistically<br />
significant: the rating of the speech qualities is not different in men and women.<br />
The analysis of the preferred sounds according the acoustic parameters has been carried out, as<br />
shown in figure 3, separately for each sound: Six sounds ((5-7-23-15-11-19) are clearly rejected:<br />
they are rated as louder, very close, and to have a low RT. These sounds are corresponding to the<br />
source position 2, and receiver position 1.<br />
Five sounds (13, 21, 1, 9, 22) are positively rated: They have a high intensity score, low in perceived<br />
distance, and have high scores in reverberation and clarity.<br />
A synthetic summary from this type of analysis is given table 3.