ERATO Proceedings Istanbul 2006.pdf - Odeon
ERATO Proceedings Istanbul 2006.pdf - Odeon
ERATO Proceedings Istanbul 2006.pdf - Odeon

You also want an ePaper? Increase the reach of your titles
YUMPU automatically turns print PDFs into web optimized ePapers that Google loves.
Distance<br />
90,0<br />
80,0<br />
70,0<br />
60,0<br />
50,0<br />
40,0<br />
30,0<br />
20,0<br />
10,0<br />
0,0<br />
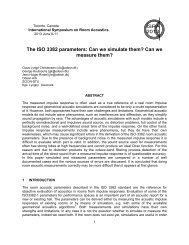
3 23 7 15 11 19 13 1 9 21 17 5 Tot 16 14 8 18 4 22 20 6 10 12 24 2<br />
Distance 21,1 22,0 22,9 23,9 27,1 27,7 29,6 33,8 34,5 34,9 38,1 39,8 50,1 60,5 63,1 64,9 66,2 69,1 70,9 71,1 72,5 74,6 75,0 78,1 80,5<br />
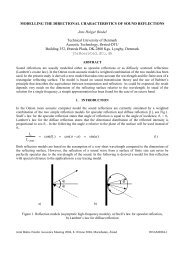
Figure 3: The distance source-receiver is very discriminating in speech acoustic<br />
Ident Config Source Receiver Dist. Reverb Strength Clarity STI Colon Wall Canop<br />
1 CNSWNC 1 1 24,5 1.27 -4.9 12.4 0.90 1 0 0<br />
9 CSWNC 1 1 24,5 1.73 -4.3 8.3 0.80 1 1 0<br />
13 NCNSWNC 1 1 24,5 0.86 -4.9 13.8 0.91 0 0 0<br />
21 NCSWNC 1 1 24,5 1.42 -4.4 9.4 0.82 0 1 0<br />
22 NCSWNC 1 2 51,9 1.38 -10.7 9.5 0.80 0 1 0<br />
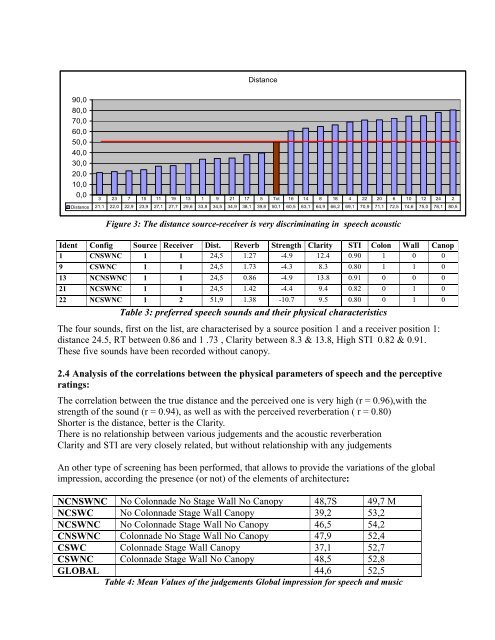
Table 3: preferred speech sounds and their physical characteristics<br />
The four sounds, first on the list, are characterised by a source position 1 and a receiver position 1:<br />
distance 24.5, RT between 0.86 and 1 .73 , Clarity between 8.3 & 13.8, High STI 0.82 & 0.91.<br />
These five sounds have been recorded without canopy.<br />
2.4 Analysis of the correlations between the physical parameters of speech and the perceptive<br />
ratings:<br />
The correlation between the true distance and the perceived one is very high (r = 0.96),with the<br />
strength of the sound (r = 0.94), as well as with the perceived reverberation ( r = 0.80)<br />
Shorter is the distance, better is the Clarity.<br />
There is no relationship between various judgements and the acoustic reverberation<br />
Clarity and STI are very closely related, but without relationship with any judgements<br />
An other type of screening has been performed, that allows to provide the variations of the global<br />
impression, according the presence (or not) of the elements of architecture:<br />
NCNSWNC No Colonnade No Stage Wall No Canopy 48,7S 49,7 M<br />
NCSWC No Colonnade Stage Wall Canopy 39,2 53,2<br />
NCSWNC No Colonnade Stage Wall No Canopy 46,5 54,2<br />
CNSWNC Colonnade No Stage Wall No Canopy 47,9 52,4<br />
CSWC Colonnade Stage Wall Canopy 37,1 52,7<br />
CSWNC Colonnade Stage Wall No Canopy 48,5 52,8<br />
GLOBAL 44,6 52,5<br />
Table 4: Mean Values of the judgements Global impression for speech and music