- Page 1 and 2:
Executive Summary In the fall of 20
- Page 3 and 4:
Contents Executive Summary………
- Page 5 and 6:
Methods The Institute for Communica
- Page 7 and 8:
Survey Sent Gross Returned Gross Re
- Page 9 and 10:
Performance Planning Question 2: Ho
- Page 11 and 12:
Performance Planning Question 4: Wa
- Page 13 and 14:
Performance Planning Question 6: Ho
- Page 15 and 16:
Performance Planning Question 8: Ho
- Page 17 and 18:
Performance Planning Question 10: D
- Page 19 and 20:
Performance Planning Question 12: H
- Page 21 and 22:
Performance Planning Question 14: T
- Page 23 and 24:
work,” and “More confusion.”
- Page 25 and 26:
Performance Planning Question 16: W
- Page 27 and 28:
espondents include, “Cancel it al
- Page 29 and 30:
Ongoing Coaching and Feedback Quest
- Page 31 and 32:
Ongoing Coaching and Feedback Quest
- Page 33 and 34:
Ongoing Coaching and Feedback Quest
- Page 35 and 36:
nearly 7% of the responses to this
- Page 37 and 38:
Miscellaneous This category account
- Page 39 and 40: Effectiveness Approximately 7% of t
- Page 41 and 42: general need for more training, and
- Page 43 and 44: Communication The Communication cat
- Page 45 and 46: Benefits and Areas for Improvement
- Page 47 and 48: The respondents stated issues such
- Page 49 and 50: Benefits and Areas for Improvement
- Page 51 and 52: Miscellaneous Approximately 10% of
- Page 53 and 54: Demographics Question 31: What is y
- Page 55 and 56: Demographics Question 33: At which
- Page 57 and 58: Demographics Question 35: Using the
- Page 59 and 60: Performance Planning Question 1: Di
- Page 61 and 62: “forgot.” Another response was,
- Page 63 and 64: Performance Planning Question 3: In
- Page 65 and 66: Performance Planning Question 5: Ho
- Page 67 and 68: Performance Planning Question 7: On
- Page 69 and 70: Coaching and Feedback Question 9: T
- Page 71 and 72: Midyear Review - IT Supervisors Onl
- Page 73 and 74: Midyear Review - IT Supervisors Onl
- Page 75 and 76: Yearend Review - IT Supervisors Onl
- Page 77 and 78: Yearend Review - IT Supervisors Onl
- Page 79 and 80: Yearend Review - IT Supervisors Onl
- Page 81 and 82: Yearend Review - IT Supervisors Onl
- Page 83 and 84: The Performance Management Process
- Page 85 and 86: Benefits and Areas for Improvement
- Page 87 and 88: Restructure Program Eight of the 36
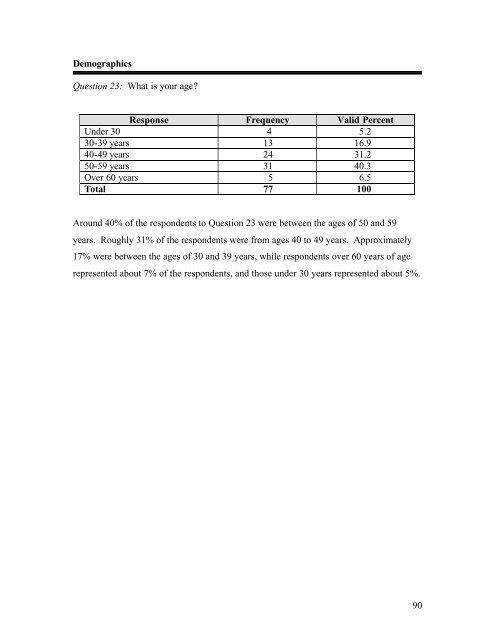
- Page 89: Demographics Question 22: What is y
- Page 93 and 94: Demographics Question 26: Which bes
- Page 95 and 96: Demographics Question 28: Whom do y
- Page 97 and 98: Demographics Question 30: Using the
- Page 99 and 100: Performance Planning Question 1: Di
- Page 101 and 102: Performance Planning Question 3: Th
- Page 103 and 104: Performance Planning Question 5: To
- Page 105 and 106: Performance Planning Question 7: Ho
- Page 107 and 108: Performance Planning Question 9: To
- Page 109 and 110: Performance Planning Question 11: D
- Page 111 and 112: Performance Planning Question 13: H
- Page 113 and 114: Performance Planning Question 15: W
- Page 115 and 116: Performance Planning Question 16: W
- Page 117 and 118: Ongoing Coaching and Feedback Quest
- Page 119 and 120: Ongoing Coaching and Feedback Quest
- Page 121 and 122: Ongoing Coaching and Feedback Quest
- Page 123 and 124: Ongoing Coaching and Feedback Quest
- Page 125 and 126: Ongoing Coaching and Feedback Quest
- Page 127 and 128: Midyear Review Question 26: Did you
- Page 129 and 130: Midyear Review Question 28: How sat
- Page 131 and 132: Yearend Review Question 30: Did you
- Page 133 and 134: Yearend Review Question 32: Did you
- Page 135 and 136: Training Question 34: Do you have a
- Page 137 and 138: Benfits and Areas for Improvement Q
- Page 139 and 140: Miscellaneous Approximately 9% of r
- Page 141 and 142:
Benfits and Areas for Improvement Q
- Page 143 and 144:
Pay The final category, Pay, accoun
- Page 145 and 146:
Supervisor Changes About 23% of res
- Page 147 and 148:
Demographics Question 40: What is y
- Page 149 and 150:
Demographics Question 42: At which
- Page 151 and 152:
Demographics Question 44: Using the
- Page 153 and 154:
Use of the Supervisor Feedback Form
- Page 155 and 156:
who responded to this question said
- Page 157 and 158:
Appendix B Responses to Classified
- Page 159 and 160:
• Didn’t seem to create any Que
- Page 161 and 162:
• This will still not help with d
- Page 163 and 164:
• None • This stage is not appl
- Page 165 and 166:
• None • Better rapport o my su
- Page 167 and 168:
• All of the above • MBA • I
- Page 169 and 170:
• Inproved communication with you
- Page 171 and 172:
• Basically setting the goals hig
- Page 173 and 174:
oles they are in. Some people are e
- Page 175 and 176:
• Time • Supervisor support/inv
- Page 177 and 178:
• Process initiated but not compl
- Page 179 and 180:
• I went through the training and
- Page 181 and 182:
• Reduce paperwork involved. Prov
- Page 183 and 184:
Appendix D Responses to Information
- Page 185 and 186:
• Keeping current with software &
- Page 187 and 188:
Question 38:What else do you need i