Beyond Glass Ceilings and Brick Walls - International Labour ...
Beyond Glass Ceilings and Brick Walls - International Labour ...
Beyond Glass Ceilings and Brick Walls - International Labour ...

You also want an ePaper? Increase the reach of your titles
YUMPU automatically turns print PDFs into web optimized ePapers that Google loves.
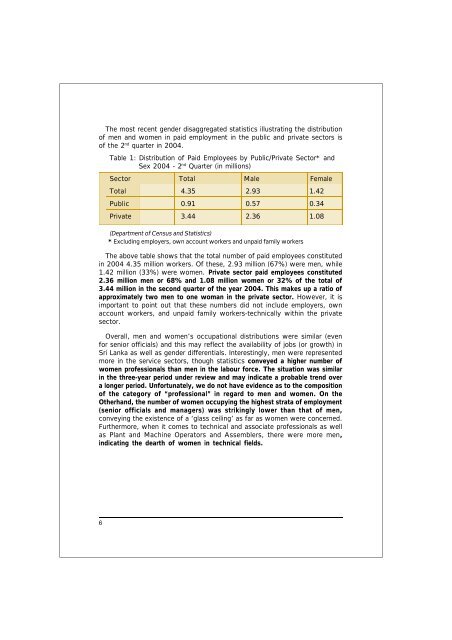
The most recent gender disaggregated statistics illustrating the distribution<br />
of men <strong>and</strong> women in paid employment in the public <strong>and</strong> private sectors is<br />
of the 2 nd quarter in 2004.<br />
Table 1: Distribution of Paid Employees by Public/Private Sector* <strong>and</strong><br />
Sex 2004 - 2 nd Quarter (in millions)<br />
Sector Total Male Female<br />
Total 4.35 2.93 1.42<br />
Public 0.91 0.57 0.34<br />
Private 3.44 2.36 1.08<br />
(Department of Census <strong>and</strong> Statistics)<br />
* Excluding employers, own account workers <strong>and</strong> unpaid family workers<br />
The above table shows that the total number of paid employees constituted<br />
in 2004 4.35 million workers. Of these, 2.93 million (67%) were men, while<br />
1.42 million (33%) were women. Private sector paid employees constituted<br />
2.36 million men or 68% <strong>and</strong> 1.08 million women or 32% of the total of<br />
3.44 million in the second quarter of the year 2004. This makes up a ratio of<br />
approximately two men to one woman in the private sector. However, it is<br />
important to point out that these numbers did not include employers, own<br />
account workers, <strong>and</strong> unpaid family workers-technically within the private<br />
sector.<br />
Overall, men <strong>and</strong> women’s occupational distributions were similar (even<br />
for senior officials) <strong>and</strong> this may reflect the availability of jobs (or growth) in<br />
Sri Lanka as well as gender differentials. Interestingly, men were represented<br />
more in the service sectors, though statistics conveyed a higher number of<br />
women professionals than men in the labour force. The situation was similar<br />
in the three-year period under review <strong>and</strong> may indicate a probable trend over<br />
a longer period. Unfortunately, we do not have evidence as to the composition<br />
of the category of “professional” in regard to men <strong>and</strong> women. On the<br />
Otherh<strong>and</strong>, the number of women occupying the highest strata of employment<br />
(senior officials <strong>and</strong> managers) was strikingly lower than that of men,<br />
conveying the existence of a ‘glass ceiling’ as far as women were concerned.<br />
Furthermore, when it comes to technical <strong>and</strong> associate professionals as well<br />
as Plant <strong>and</strong> Machine Operators <strong>and</strong> Assemblers, there were more men,<br />
indicating the dearth of women in technical fields.<br />
6