The Pave Project Report - Queen's University Belfast
The Pave Project Report - Queen's University Belfast
The Pave Project Report - Queen's University Belfast

Create successful ePaper yourself
Turn your PDF publications into a flip-book with our unique Google optimized e-Paper software.
<strong>The</strong> PAVE <strong>Project</strong> <strong>Report</strong> 125<br />
GHQ-30- A1<br />
BDI-II– A1<br />
PDS – A1<br />
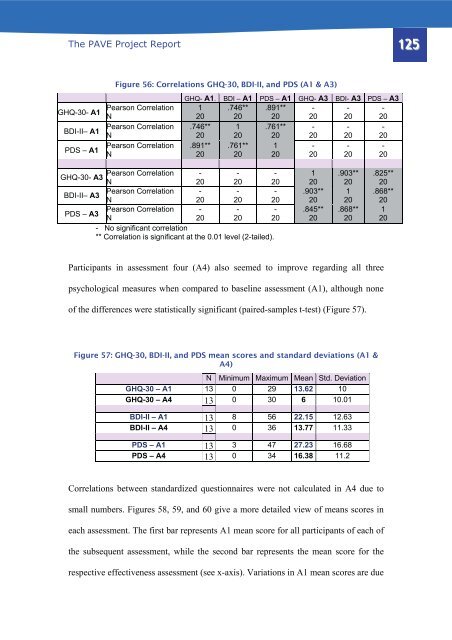
Figure 56: Correlations GHQ-30, BDI-II, and PDS (A1 & A3)<br />
Pearson Correlation<br />
N<br />
Pearson Correlation<br />
N<br />
Pearson Correlation<br />
N<br />
GHQ- A1. BDI – A1 PDS – A1 GHQ- A3 BDI- A3 PDS – A3<br />
1 .746** .891** - - -<br />
20 20 20 20 20 20<br />
.746** 1 .761** - - -<br />
20 20 20 20 20 20<br />
.891** .761** 1 - - -<br />
20 20 20 20 20 20<br />
Pearson Correlation<br />
GHQ-30- A3<br />
N<br />
BDI-II– A3<br />
Pearson Correlation<br />
N<br />
PDS – A3<br />
Pearson Correlation<br />
N<br />
- -<br />
20 20<br />
- -<br />
20 20<br />
- -<br />
20 20<br />
- No significant correlation<br />
** Correlation is significant at the 0.01 level (2-tailed).<br />
-<br />
20<br />
-<br />
20<br />
-<br />
20<br />
1<br />
20<br />
.903**<br />
20<br />
.845**<br />
20<br />
.903**<br />
20<br />
1<br />
20<br />
.868**<br />
20<br />
.825**<br />
20<br />
.868**<br />
20<br />
1<br />
20<br />
Participants in assessment four (A4) also seemed to improve regarding all three<br />
psychological measures when compared to baseline assessment (A1), although none<br />
of the differences were statistically significant (paired-samples t-test) (Figure 57).<br />
Figure 57: GHQ-30, BDI-II, and PDS mean scores and standard deviations (A1 &<br />
A4)<br />
N Minimum Maximum Mean Std. Deviation<br />
GHQ-30 – A1 13 0 29 13.62 10<br />
GHQ-30 – A4 13 0 30 6 10.01<br />
BDI-II – A1 13 8 56 22.15 12.63<br />
BDI-II – A4 13 0 36 13.77 11.33<br />
PDS – A1 13 3 47 27.23 16.68<br />
PDS – A4 13 0 34 16.38 11.2<br />
Correlations between standardized questionnaires were not calculated in A4 due to<br />
small numbers. Figures 58, 59, and 60 give a more detailed view of means scores in<br />
each assessment. <strong>The</strong> first bar represents A1 mean score for all participants of each of<br />
the subsequent assessment, while the second bar represents the mean score for the<br />
respective effectiveness assessment (see x-axis). Variations in A1 mean scores are due