User Guide and Manual for Project Canary
User Guide and Manual for Project Canary
User Guide and Manual for Project Canary
Create successful ePaper yourself
Turn your PDF publications into a flip-book with our unique Google optimized e-Paper software.
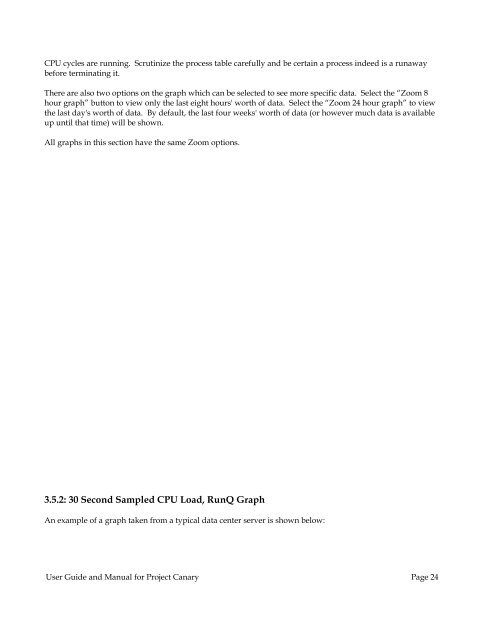
CPU cycles are running. Scrutinize the process table carefully <strong>and</strong> be certain a process indeed is a runaway<br />
be<strong>for</strong>e terminating it.<br />
There are also two options on the graph which can be selected to see more specific data. Select the “Zoom 8<br />
hour graph” button to view only the last eight hours' worth of data. Select the “Zoom 24 hour graph” to view<br />
the last day's worth of data. By default, the last four weeks' worth of data (or however much data is available<br />
up until that time) will be shown.<br />
All graphs in this section have the same Zoom options.<br />
3.5.2: 30 Second Sampled CPU Load, RunQ Graph<br />
An example of a graph taken from a typical data center server is shown below:<br />
<strong>User</strong> <strong>Guide</strong> <strong>and</strong> <strong>Manual</strong> <strong>for</strong> <strong>Project</strong> <strong>Canary</strong> Page 24


