

User Guide and Manual for Project Canary
User Guide and Manual for Project Canary
User Guide and Manual for Project Canary

Create successful ePaper yourself
Turn your PDF publications into a flip-book with our unique Google optimized e-Paper software.
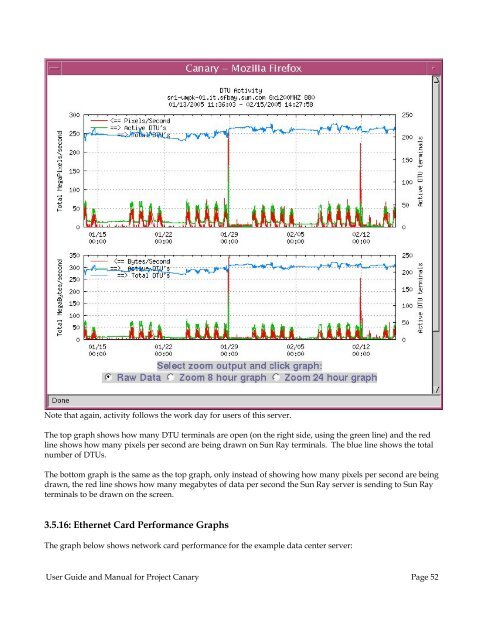
Note that again, activity follows the work day <strong>for</strong> users of this server.<br />
The top graph shows how many DTU terminals are open (on the right side, using the green line) <strong>and</strong> the red<br />
line shows how many pixels per second are being drawn on Sun Ray terminals. The blue line shows the total<br />
number of DTUs.<br />
The bottom graph is the same as the top graph, only instead of showing how many pixels per second are being<br />
drawn, the red line shows how many megabytes of data per second the Sun Ray server is sending to Sun Ray<br />
terminals to be drawn on the screen.<br />
3.5.16: Ethernet Card Per<strong>for</strong>mance Graphs<br />
The graph below shows network card per<strong>for</strong>mance <strong>for</strong> the example data center server:<br />
<strong>User</strong> <strong>Guide</strong> <strong>and</strong> <strong>Manual</strong> <strong>for</strong> <strong>Project</strong> <strong>Canary</strong> Page 52


