

User Guide and Manual for Project Canary
User Guide and Manual for Project Canary
User Guide and Manual for Project Canary

Create successful ePaper yourself
Turn your PDF publications into a flip-book with our unique Google optimized e-Paper software.
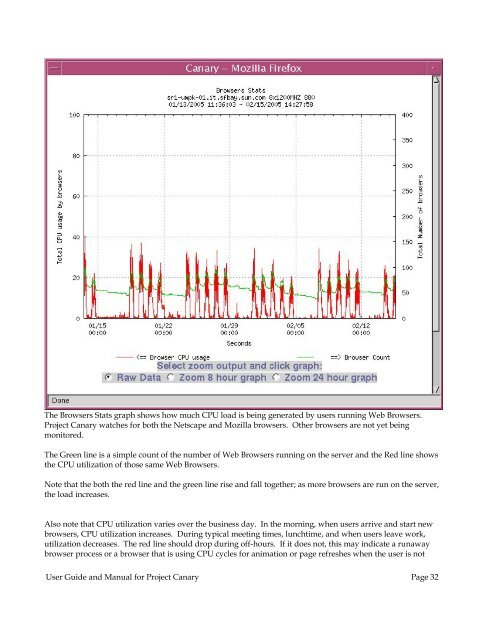
The Browsers Stats graph shows how much CPU load is being generated by users running Web Browsers.<br />
<strong>Project</strong> <strong>Canary</strong> watches <strong>for</strong> both the Netscape <strong>and</strong> Mozilla browsers. Other browsers are not yet being<br />
monitored.<br />
The Green line is a simple count of the number of Web Browsers running on the server <strong>and</strong> the Red line shows<br />
the CPU utilization of those same Web Browsers.<br />
Note that the both the red line <strong>and</strong> the green line rise <strong>and</strong> fall together; as more browsers are run on the server,<br />
the load increases.<br />
Also note that CPU utilization varies over the business day. In the morning, when users arrive <strong>and</strong> start new<br />
browsers, CPU utilization increases. During typical meeting times, lunchtime, <strong>and</strong> when users leave work,<br />
utilization decreases. The red line should drop during off-hours. If it does not, this may indicate a runaway<br />
browser process or a browser that is using CPU cycles <strong>for</strong> animation or page refreshes when the user is not<br />
<strong>User</strong> <strong>Guide</strong> <strong>and</strong> <strong>Manual</strong> <strong>for</strong> <strong>Project</strong> <strong>Canary</strong> Page 32


