

User Guide and Manual for Project Canary
User Guide and Manual for Project Canary
User Guide and Manual for Project Canary

You also want an ePaper? Increase the reach of your titles
YUMPU automatically turns print PDFs into web optimized ePapers that Google loves.
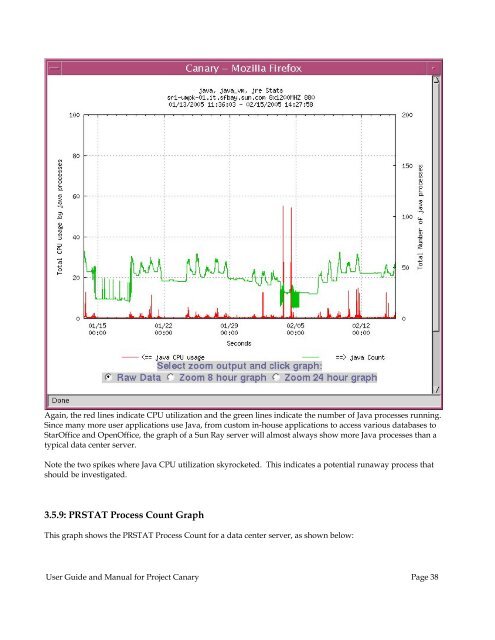
Again, the red lines indicate CPU utilization <strong>and</strong> the green lines indicate the number of Java processes running.<br />
Since many more user applications use Java, from custom in-house applications to access various databases to<br />
StarOffice <strong>and</strong> OpenOffice, the graph of a Sun Ray server will almost always show more Java processes than a<br />
typical data center server.<br />
Note the two spikes where Java CPU utilization skyrocketed. This indicates a potential runaway process that<br />
should be investigated.<br />
3.5.9: PRSTAT Process Count Graph<br />
This graph shows the PRSTAT Process Count <strong>for</strong> a data center server, as shown below:<br />
<strong>User</strong> <strong>Guide</strong> <strong>and</strong> <strong>Manual</strong> <strong>for</strong> <strong>Project</strong> <strong>Canary</strong> Page 38


