

User Guide and Manual for Project Canary
User Guide and Manual for Project Canary
User Guide and Manual for Project Canary

Create successful ePaper yourself
Turn your PDF publications into a flip-book with our unique Google optimized e-Paper software.
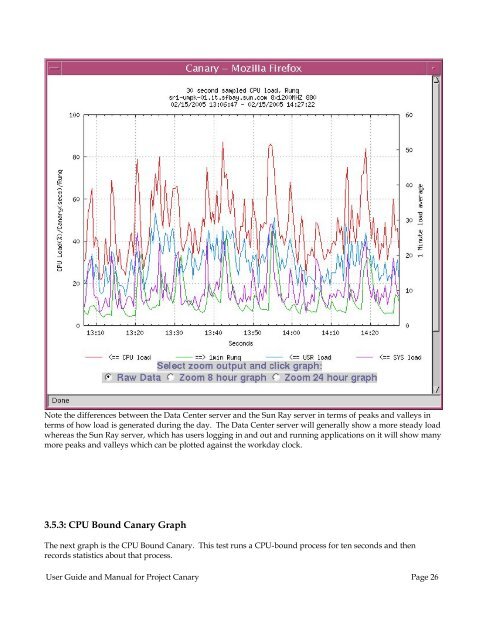
Note the differences between the Data Center server <strong>and</strong> the Sun Ray server in terms of peaks <strong>and</strong> valleys in<br />
terms of how load is generated during the day. The Data Center server will generally show a more steady load<br />
whereas the Sun Ray server, which has users logging in <strong>and</strong> out <strong>and</strong> running applications on it will show many<br />
more peaks <strong>and</strong> valleys which can be plotted against the workday clock.<br />
3.5.3: CPU Bound <strong>Canary</strong> Graph<br />
The next graph is the CPU Bound <strong>Canary</strong>. This test runs a CPU-bound process <strong>for</strong> ten seconds <strong>and</strong> then<br />
records statistics about that process.<br />
<strong>User</strong> <strong>Guide</strong> <strong>and</strong> <strong>Manual</strong> <strong>for</strong> <strong>Project</strong> <strong>Canary</strong> Page 26


