

User Guide and Manual for Project Canary
User Guide and Manual for Project Canary
User Guide and Manual for Project Canary

Create successful ePaper yourself
Turn your PDF publications into a flip-book with our unique Google optimized e-Paper software.
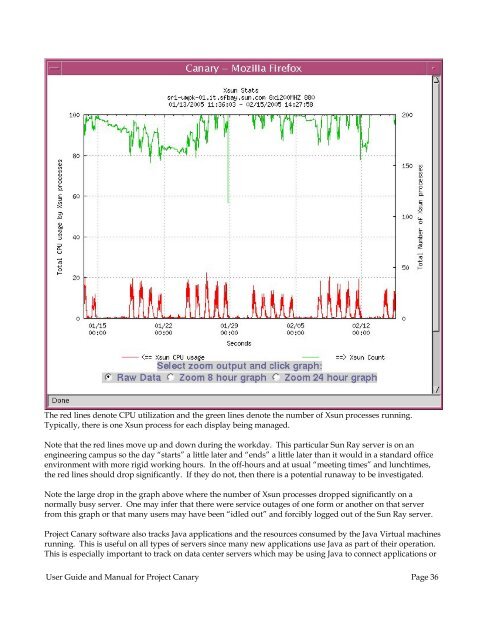
The red lines denote CPU utilization <strong>and</strong> the green lines denote the number of Xsun processes running.<br />
Typically, there is one Xsun process <strong>for</strong> each display being managed.<br />
Note that the red lines move up <strong>and</strong> down during the workday. This particular Sun Ray server is on an<br />
engineering campus so the day “starts” a little later <strong>and</strong> “ends” a little later than it would in a st<strong>and</strong>ard office<br />
environment with more rigid working hours. In the off-hours <strong>and</strong> at usual “meeting times” <strong>and</strong> lunchtimes,<br />
the red lines should drop significantly. If they do not, then there is a potential runaway to be investigated.<br />
Note the large drop in the graph above where the number of Xsun processes dropped significantly on a<br />
normally busy server. One may infer that there were service outages of one <strong>for</strong>m or another on that server<br />
from this graph or that many users may have been “idled out” <strong>and</strong> <strong>for</strong>cibly logged out of the Sun Ray server.<br />
<strong>Project</strong> <strong>Canary</strong> software also tracks Java applications <strong>and</strong> the resources consumed by the Java Virtual machines<br />
running. This is useful on all types of servers since many new applications use Java as part of their operation.<br />
This is especially important to track on data center servers which may be using Java to connect applications or<br />
<strong>User</strong> <strong>Guide</strong> <strong>and</strong> <strong>Manual</strong> <strong>for</strong> <strong>Project</strong> <strong>Canary</strong> Page 36


