Nevada Greenhouse Gas Inventory and Reference Case Projections
Nevada Greenhouse Gas Inventory and Reference Case Projections
Nevada Greenhouse Gas Inventory and Reference Case Projections
Create successful ePaper yourself
Turn your PDF publications into a flip-book with our unique Google optimized e-Paper software.
FINAL <strong>Nevada</strong> GHG <strong>Inventory</strong> <strong>and</strong> <strong>Reference</strong> <strong>Case</strong> Projection<br />
CCS, July 2007<br />
Historical Emissions<br />
Overview<br />
Preliminary analyses suggest that in 2005, activities in <strong>Nevada</strong> accounted for approximately 49.5<br />
million metric tons (MMt) of CO 2 e emissions, an amount equal to 0.7% of total U.S. GHG<br />
emissions. 3 <strong>Nevada</strong>’s gross GHG emissions are rising faster than those of the nation as a whole.<br />
<strong>Nevada</strong>’s gross GHG emissions were increased by 62% from 1990 to 2004, while national<br />
emissions rose only 16% during the same period. As noted further below, these emissions are<br />
largely driven by <strong>Nevada</strong>’s rapid population growth during the period of analysis.<br />
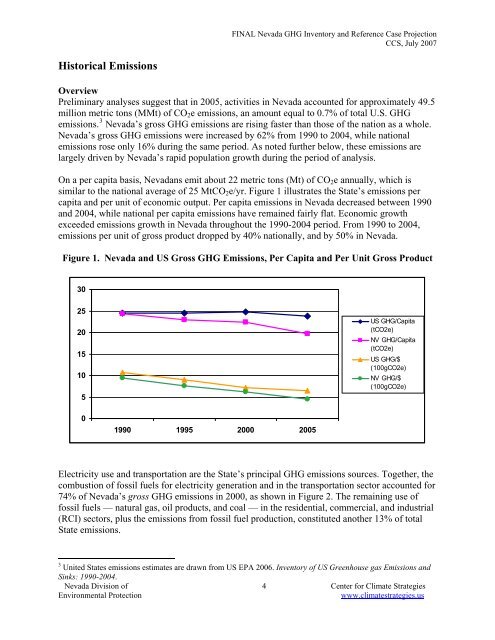
On a per capita basis, <strong>Nevada</strong>ns emit about 22 metric tons (Mt) of CO 2 e annually, which is<br />
similar to the national average of 25 MtCO 2 e/yr. Figure 1 illustrates the State’s emissions per<br />
capita <strong>and</strong> per unit of economic output. Per capita emissions in <strong>Nevada</strong> decreased between 1990<br />
<strong>and</strong> 2004, while national per capita emissions have remained fairly flat. Economic growth<br />
exceeded emissions growth in <strong>Nevada</strong> throughout the 1990-2004 period. From 1990 to 2004,<br />
emissions per unit of gross product dropped by 40% nationally, <strong>and</strong> by 50% in <strong>Nevada</strong>.<br />
Figure 1. <strong>Nevada</strong> <strong>and</strong> US Gross GHG Emissions, Per Capita <strong>and</strong> Per Unit Gross Product<br />
30<br />
25<br />
20<br />
15<br />
10<br />
5<br />
US GHG/Capita<br />
(tCO2e)<br />
NV GHG/Capita<br />
(tCO2e)<br />
US GHG/$<br />
(100gCO2e)<br />
NV GHG/$<br />
(100gCO2e)<br />
0<br />
1990 1995 2000 2005<br />
Electricity use <strong>and</strong> transportation are the State’s principal GHG emissions sources. Together, the<br />
combustion of fossil fuels for electricity generation <strong>and</strong> in the transportation sector accounted for<br />
74% of <strong>Nevada</strong>’s gross GHG emissions in 2000, as shown in Figure 2. The remaining use of<br />
fossil fuels — natural gas, oil products, <strong>and</strong> coal — in the residential, commercial, <strong>and</strong> industrial<br />
(RCI) sectors, plus the emissions from fossil fuel production, constituted another 13% of total<br />
State emissions.<br />
3 United States emissions estimates are drawn from US EPA 2006. <strong>Inventory</strong> of US <strong>Greenhouse</strong> gas Emissions <strong>and</strong><br />
Sinks: 1990-2004.<br />
<strong>Nevada</strong> Division of 4 Center for Climate Strategies<br />
Environmental Protection<br />
www.climatestrategies.us


