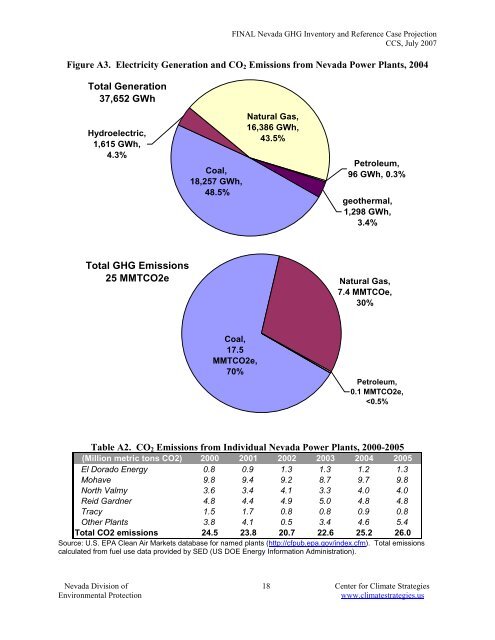
FINAL <strong>Nevada</strong> GHG <strong>Inventory</strong> <strong>and</strong> <strong>Reference</strong> <strong>Case</strong> Projection CCS, July 2007 Figure A3. Electricity Generation <strong>and</strong> CO 2 Emissions from <strong>Nevada</strong> Power Plants, 2004 Total Generation 37,652 GWh Hydroelectric, 1,615 GWh, 4.3% Coal, 18,257 GWh, 48.5% Natural <strong>Gas</strong>, 16,386 GWh, 43.5% Petroleum, 96 GWh, 0.3% geothermal, 1,298 GWh, 3.4% Total GHG Emissions 25 MMTCO2e Natural <strong>Gas</strong>, 7.4 MMTCOe, 30% Coal, 17.5 MMTCO2e, 70% Petroleum, 0.1 MMTCO2e,
FINAL <strong>Nevada</strong> GHG <strong>Inventory</strong> <strong>and</strong> <strong>Reference</strong> <strong>Case</strong> Projection CCS, July 2007 Table A3 shows the growth in generation by fuel type between 1990 <strong>and</strong> 2004. Overall generation grew by 4.7 percent over the 15 years, while electricity consumption grew by 4.6 percent. In <strong>Nevada</strong>, natural gas generation has had particularly strong growth, increasing by more than seven times from 1990 to 2004. Coal generation grew more slowly but remains the dominant source of electricity in the State. Hydro generation shows a decrease between 1990 <strong>and</strong> 2004, but the table masks the considerable year-by-year variation from this resource. In the 15- year period, hydro generation ranged from a low of 1,615 GWh in 2004 to a high of 3,166 GWh in 1998. Table A3. Growth in Electricity Generation in <strong>Nevada</strong> 1990-2004. Generation (GWh) Growth 1990 2004 Coal 15,053 18,257 21% Hydroelectric 1,735 1,615 -7% Natural <strong>Gas</strong> 2,217 16,386 639% geothermal, solar, wind 761 1,298 70% Petroleum 284 96 -66% Total 20,051 37,652 88% Source: EIA Electric Power Annual Data Future Generation <strong>and</strong> Emissions Estimating future generation <strong>and</strong> GHG emissions from <strong>Nevada</strong> power plants requires estimation of new power plant additions <strong>and</strong> production levels from new <strong>and</strong> existing power plants. There are, of course, large uncertainties, especially related to the timing <strong>and</strong> nature of new power plant construction. The future mix of plants in <strong>Nevada</strong> remains uncertain as the trends in type of new builds are influenced by many factors. Since 2000, new fossil-fuel plants in <strong>Nevada</strong> have been natural gasfired; however, coal dominates the new plants that have been proposed recently in the State. Sierra Pacific Power <strong>and</strong> <strong>Nevada</strong> Power Company are also showing interest in new wind <strong>and</strong> geothermal plants, in part to meet new renewable generation requirements. Table A4 presents data on new <strong>and</strong> proposed plants in <strong>Nevada</strong>. Individual proposed plants are not modeled in the reference case projections, but the mix of types of proposed plants are considered when developing assumptions. <strong>Nevada</strong> Division of 19 Center for Climate Strategies Environmental Protection www.climatestrategies.us