Design Guide - Solvay Plastics
Design Guide - Solvay Plastics
Design Guide - Solvay Plastics

Create successful ePaper yourself
Turn your PDF publications into a flip-book with our unique Google optimized e-Paper software.
Thermal Stability<br />
The general term, thermal stability, is used to describe<br />
the ability of a material to resist loss of properties due<br />
to heat. Various methods are used to evaluate this<br />
tendency. In the next section, we will discuss several<br />
of these methods, including thermogravimetric analysis,<br />
and long-term heat aging.<br />
Thermogravimetric Analysis (TGA)<br />
Thermogravimetric analysis is performed by increasing<br />
the temperature of a small sample of the test material<br />
at a constant rate while monitoring its weight. The<br />
atmosphere is controlled and the test can be performed<br />
using air or an inert atmosphere, such as nitrogen.<br />
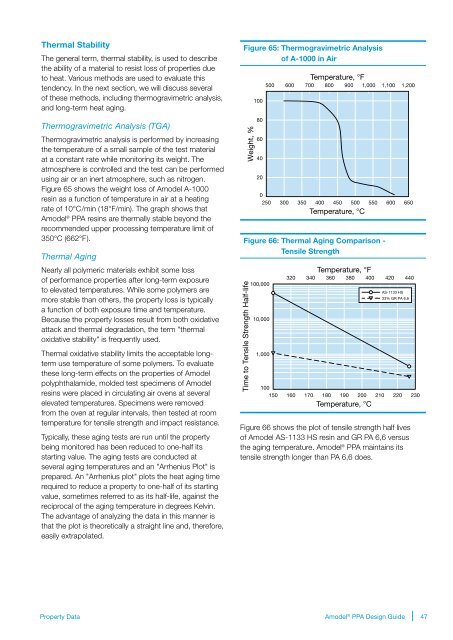
Figure 65 shows the weight loss of Amodel A-1000<br />
resin as a function of temperature in air at a heating<br />
rate of 10°C/min (18°F/min). The graph shows that<br />
Amodel ® PPA resins are thermally stable beyond the<br />
recommended upper processing temperature limit of<br />
350°C (662°F).<br />
Thermal Aging<br />
Nearly all polymeric materials exhibit some loss<br />
of performance properties after long-term exposure<br />
to elevated temperatures. While some polymers are<br />
more stable than others, the property loss is typically<br />
a function of both exposure time and temperature.<br />
Because the property losses result from both oxidative<br />
attack and thermal degradation, the term "thermal<br />
oxidative stability" is frequently used.<br />
Thermal oxidative stability limits the acceptable longterm<br />
use temperature of some polymers. To evaluate<br />
these long-term effects on the properties of Amodel<br />
polyphthalamide, molded test specimens of Amodel<br />
resins were placed in circulating air ovens at several<br />
elevated temperatures. Specimens were removed<br />
from the oven at regular intervals, then tested at room<br />
temperature for tensile strength and impact resistance.<br />
Typically, these aging tests are run until the property<br />
being monitored has been reduced to one-half its<br />
starting value. The aging tests are conducted at<br />
several aging temperatures and an "Arrhenius Plot" is<br />
prepared. An "Arrhenius plot" plots the heat aging time<br />
required to reduce a property to one-half of its starting<br />
value, sometimes referred to as its half-life, against the<br />
reciprocal of the aging temperature in degrees Kelvin.<br />
The advantage of analyzing the data in this manner is<br />
that the plot is theoretically a straight line and, therefore,<br />
easily extrapolated.<br />
Figure 65: Thermogravimetric Analysis<br />
of A-1000 in Air<br />
Weight, %<br />
100<br />
80<br />
60<br />
40<br />
20<br />
Temperature, °F<br />
500 600 700 800 900 1,000 1,100 1,200<br />
0<br />
250 300 350 400 450 500 550 600 650<br />
Temperature, °C<br />
Figure 66: Thermal Aging Comparison -<br />
Tensile Strength<br />
Time to Tensile Strength Half-life<br />
100,000<br />
10,000<br />
1,000<br />
Temperature, °F<br />
320 340 360 380 400 420 440<br />
100<br />
150 160 170 180 190 200 210 220 230<br />
Temperature, °C<br />
AS-1133 HS<br />
33% GR PA 6,6<br />
Figure 66 shows the plot of tensile strength half lives<br />
of Amodel AS-1133 HS resin and GR PA 6,6 versus<br />
the aging temperature. Amodel ® PPA maintains its<br />
tensile strength longer than PA 6,6 does.<br />
Property Data<br />
Amodel ® PPA <strong>Design</strong> <strong>Guide</strong><br />
47