

Chapter 1 Minimum Flows and Levels - Southwest Florida Water ...
Chapter 1 Minimum Flows and Levels - Southwest Florida Water ...
Chapter 1 Minimum Flows and Levels - Southwest Florida Water ...

Create successful ePaper yourself
Turn your PDF publications into a flip-book with our unique Google optimized e-Paper software.
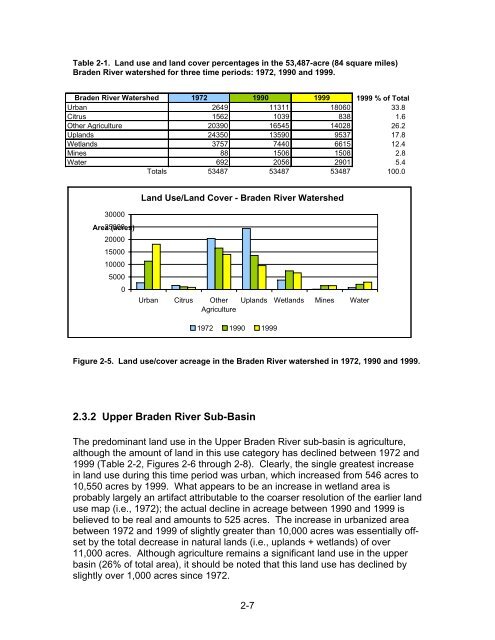
Table 2-1. L<strong>and</strong> use <strong>and</strong> l<strong>and</strong> cover percentages in the 53,487-acre (84 square miles)<br />
Braden River watershed for three time periods: 1972, 1990 <strong>and</strong> 1999.<br />
Braden River <strong>Water</strong>shed 1972 1990 1999 1999 % of Total<br />
Urban 2649 11311 18060 33.8<br />
Citrus 1562 1039 838 1.6<br />
Other Agriculture 20390 16545 14028 26.2<br />
Upl<strong>and</strong>s 24350 13590 9537 17.8<br />
Wetl<strong>and</strong>s 3757 7440 6615 12.4<br />
Mines 88 1506 1508 2.8<br />
<strong>Water</strong> 692 2056 2901 5.4<br />
Totals 53487 53487 53487 100.0<br />
L<strong>and</strong> Use/L<strong>and</strong> Cover - Braden River <strong>Water</strong>shed<br />
30000<br />
Area 25000 (acres)<br />
20000<br />
15000<br />
10000<br />
5000<br />
0<br />
Urban Citrus Other<br />
Agriculture<br />
Upl<strong>and</strong>s Wetl<strong>and</strong>s Mines <strong>Water</strong><br />
1972 1990 1999<br />
Figure 2-5. L<strong>and</strong> use/cover acreage in the Braden River watershed in 1972, 1990 <strong>and</strong> 1999.<br />
2.3.2 Upper Braden River Sub-Basin<br />
The predominant l<strong>and</strong> use in the Upper Braden River sub-basin is agriculture,<br />
although the amount of l<strong>and</strong> in this use category has declined between 1972 <strong>and</strong><br />
1999 (Table 2-2, Figures 2-6 through 2-8). Clearly, the single greatest increase<br />
in l<strong>and</strong> use during this time period was urban, which increased from 546 acres to<br />
10,550 acres by 1999. What appears to be an increase in wetl<strong>and</strong> area is<br />
probably largely an artifact attributable to the coarser resolution of the earlier l<strong>and</strong><br />
use map (i.e., 1972); the actual decline in acreage between 1990 <strong>and</strong> 1999 is<br />
believed to be real <strong>and</strong> amounts to 525 acres. The increase in urbanized area<br />
between 1972 <strong>and</strong> 1999 of slightly greater than 10,000 acres was essentially offset<br />
by the total decrease in natural l<strong>and</strong>s (i.e., upl<strong>and</strong>s + wetl<strong>and</strong>s) of over<br />
11,000 acres. Although agriculture remains a significant l<strong>and</strong> use in the upper<br />
basin (26% of total area), it should be noted that this l<strong>and</strong> use has declined by<br />
slightly over 1,000 acres since 1972.<br />
2-7


