

Chapter 1 Minimum Flows and Levels - Southwest Florida Water ...
Chapter 1 Minimum Flows and Levels - Southwest Florida Water ...
Chapter 1 Minimum Flows and Levels - Southwest Florida Water ...

You also want an ePaper? Increase the reach of your titles
YUMPU automatically turns print PDFs into web optimized ePapers that Google loves.
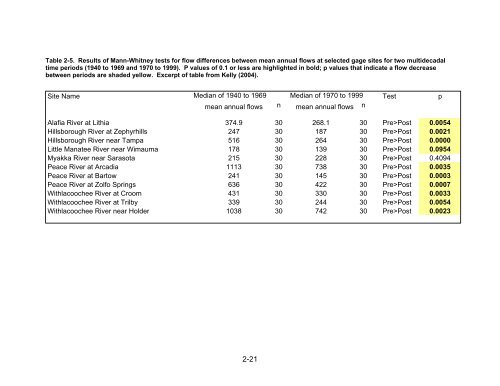
Table 2-5. Results of Mann-Whitney tests for flow differences between mean annual flows at selected gage sites for two multidecadal<br />
time periods (1940 to 1969 <strong>and</strong> 1970 to 1999). P values of 0.1 or less are highlighted in bold; p values that indicate a flow decrease<br />
between periods are shaded yellow. Excerpt of table from Kelly (2004).<br />
Site Name Median of 1940 to 1969 Median of 1970 to 1999 Test p<br />
mean annual flows n mean annual flows n<br />
Alafia River at Lithia 374.9 30 268.1 30 Pre>Post 0.0054<br />
Hillsborough River at Zephyrhills 247 30 187 30 Pre>Post 0.0021<br />
Hillsborough River near Tampa 516 30 264 30 Pre>Post 0.0000<br />
Little Manatee River near Wimauma 178 30 139 30 Pre>Post 0.0954<br />
Myakka River near Sarasota 215 30 228 30 Pre>Post 0.4094<br />
Peace River at Arcadia 1113 30 738 30 Pre>Post 0.0035<br />
Peace River at Bartow 241 30 145 30 Pre>Post 0.0003<br />
Peace River at Zolfo Springs 636 30 422 30 Pre>Post 0.0007<br />
Withlacoochee River at Croom 431 30 330 30 Pre>Post 0.0033<br />
Withlacoochee River at Trilby 339 30 244 30 Pre>Post 0.0054<br />
Withlacoochee River near Holder 1038 30 742 30 Pre>Post 0.0023<br />
2-21


