

Chapter 1 Minimum Flows and Levels - Southwest Florida Water ...
Chapter 1 Minimum Flows and Levels - Southwest Florida Water ...
Chapter 1 Minimum Flows and Levels - Southwest Florida Water ...

You also want an ePaper? Increase the reach of your titles
YUMPU automatically turns print PDFs into web optimized ePapers that Google loves.
40<br />
35<br />
30<br />
25<br />
20<br />
15<br />
10<br />
5<br />
0<br />
May<br />
June<br />
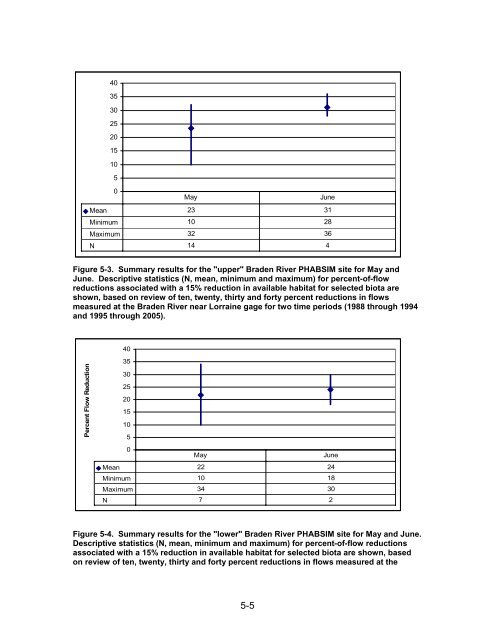
Mean 23 31<br />
<strong>Minimum</strong> 10 28<br />
Maximum 32 36<br />
N 14 4<br />
Figure 5-3. Summary results for the "upper" Braden River PHABSIM site for May <strong>and</strong><br />
June. Descriptive statistics (N, mean, minimum <strong>and</strong> maximum) for percent-of-flow<br />
reductions associated with a 15% reduction in available habitat for selected biota are<br />
shown, based on review of ten, twenty, thirty <strong>and</strong> forty percent reductions in flows<br />
measured at the Braden River near Lorraine gage for two time periods (1988 through 1994<br />
<strong>and</strong> 1995 through 2005).<br />
40<br />
Percent Flow Reduction<br />
35<br />
30<br />
25<br />
20<br />
15<br />
10<br />
5<br />
0<br />
May<br />
June<br />
Mean 22 24<br />
<strong>Minimum</strong> 10 18<br />
Maximum 34 30<br />
N 7 2<br />
Figure 5-4. Summary results for the "lower" Braden River PHABSIM site for May <strong>and</strong> June.<br />
Descriptive statistics (N, mean, minimum <strong>and</strong> maximum) for percent-of-flow reductions<br />
associated with a 15% reduction in available habitat for selected biota are shown, based<br />
on review of ten, twenty, thirty <strong>and</strong> forty percent reductions in flows measured at the<br />
5-5


