- Page 1 and 2: Proposed Minimum Flows and Levels f
- Page 3 and 4: Table of Contents TABLE OF CONTENTS
- Page 5 and 6: 5.5 PRESCRIBED FLOW REDUCTION FOR B
- Page 7 and 8: Figure 2-19. Potassium concentratio
- Page 9 and 10: Figure 5-13. Median daily flow at t
- Page 11 and 12: mean feature elevations are listed
- Page 13 and 14: For the high flow season of the yea
- Page 15 and 16: Acknowledgements The authors would
- Page 17 and 18: fluctuations in water flows or leve
- Page 19 and 20: Common to this list and the flow re
- Page 21 and 22: Fundamental to the approach used fo
- Page 23 and 24: 300 250 Block 1 Block 3 Block 2 Flo
- Page 25 and 26: are outlined in Chapter 4. In Chapt
- Page 27 and 28: as the freshwater segment upstream
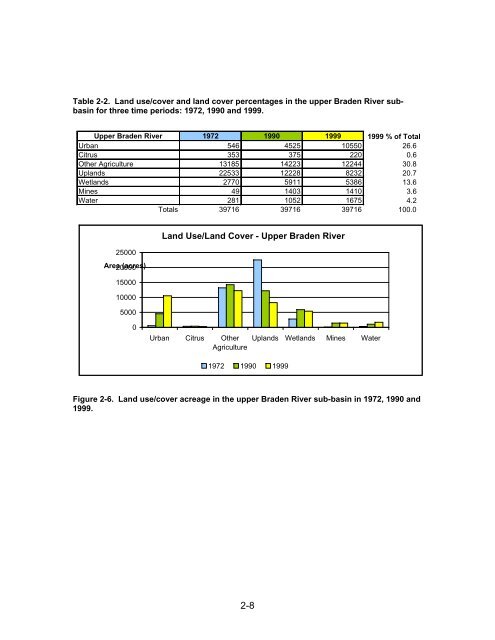
- Page 29 and 30: attributed to analytic precision di
- Page 31: Figure 2-4. 1999 land use/cover map
- Page 35 and 36: Figure 2-8. 1999 Land use/cover map
- Page 37 and 38: Figure 2-10. 1972 Land use/cover ma
- Page 39 and 40: Smith and Stopp (1978) note that "i
- Page 41 and 42: 2.4.2.1 Multidecadal Periods of Hig
- Page 43 and 44: 2.4.3.2 Step Trend in River Flows K
- Page 45 and 46: Table 2-4. Results of Kendall's tau
- Page 47 and 48: 2.4.4 Benchmark Periods Climate-bas
- Page 49 and 50: Oscillation were examined. On a sea
- Page 51 and 52: Water Chemistry 2.4.6 Water Quality
- Page 53 and 54: Braden River near Lorraine, FL 0.6
- Page 55 and 56: Peace River at Arcadia, FL 10 Potas
- Page 57 and 58: Table 2-8. Summary statistics for B
- Page 59 and 60: 3.2 Resources and Area of Concern T
- Page 61 and 62: habitat, the greater area of stream
- Page 63 and 64: levels such as fish have been shown
- Page 65 and 66: Figure 3-1. Example of low flow in
- Page 67 and 68: USGS Braden River near Lorraine gag
- Page 69 and 70: instream cross-sections were sample
- Page 71 and 72: Figure 4-2. Upstream vegetation cro
- Page 73 and 74: supports water surface profile calc
- Page 75 and 76: The HEC-RAS model was run using 21
- Page 77 and 78: Adult Spotted Sunfish Adults - Brad
- Page 79 and 80: species of interest. For example cu
- Page 81 and 82: 4.4 Seasonal Flow and Development o
- Page 83 and 84:
Wetted Perimeter - Sta. 44.9 25 20
- Page 85 and 86:
factors, the most conservative of w
- Page 87 and 88:
Chapter 5 Results and Recommended M
- Page 89 and 90:
Wetted Perimeter Requirements Flow
- Page 91 and 92:
40 35 30 25 20 15 10 5 0 May June M
- Page 93 and 94:
Floodplain profiles and vegetation
- Page 95 and 96:
mean elevation of the Oak/popash ve
- Page 97 and 98:
Table 5-3. Mean (±SD) flows at the
- Page 99 and 100:
Elevaton (NGVD) 27.0 22.0 17.0 12.0
- Page 101 and 102:
Table 5-7. Median elevations, in fe
- Page 103 and 104:
80 70 60 Flow reduction (%) 50 40 3
- Page 105 and 106:
Table 5-8. Recommended percent flow
- Page 107 and 108:
100 90 80 % DOMINANCE 70 60 50 40 3
- Page 109 and 110:
Table 5-9. Mean elevation of instre
- Page 111 and 112:
The second standard was developed t
- Page 113 and 114:
Table 5-10. Proposed Minimum Flows
- Page 115 and 116:
Division Information and Technology
- Page 117 and 118:
Hupalo, R., C. Neubauer, L. Keenan,
- Page 119 and 120:
communities in the corridors of the
- Page 121 and 122:
Wharton, C.H., W.M. Kitchens, E.C.
- Page 123 and 124:
Confined Aquifer - A term used to d
- Page 125 and 126:
Instream Habitats - A specific type
- Page 127 and 128:
Riffle - A relatively shallow reach
- Page 129 and 130:
Chapter 8 Appendix A A Review of
- Page 131 and 132:
steps to reduce the uncertainty and
- Page 133 and 134:
2007). In addition, the approach us
- Page 135 and 136:
with limited biological knowledge o
- Page 137 and 138:
the other factors listed above or w
- Page 139 and 140:
have now been developed and adopted
- Page 141 and 142:
An example of the primary output fr
- Page 143 and 144:
prevent negative effects associated
- Page 145 and 146:
methods, such as LiDAR, to improve
- Page 147 and 148:
habitat reduction criterion and the
- Page 149 and 150:
Summary, Special Publication SJ2002
- Page 151 and 152:
Errata / comments by page number in
- Page 153 and 154:
4-20 Section 4.7.1, 1 st paragraph,
- Page 155 and 156:
Chapter 9 Appendix B - Staff Respon
- Page 157 and 158:
2) The panel notes that the period
- Page 159 and 160:
4) One aspect of Chapter 2 should b
- Page 161 and 162:
Preventing Significant Harm - 15% C
- Page 163 and 164:
they aren't getting enough particul
- Page 165 and 166:
Habitat Criteria and Characterizati
- Page 167 and 168:
Compliance Standards and Proposed M
- Page 169 and 170:
Glossary of Terms 13) When an inter