

Chapter 1 Minimum Flows and Levels - Southwest Florida Water ...
Chapter 1 Minimum Flows and Levels - Southwest Florida Water ...
Chapter 1 Minimum Flows and Levels - Southwest Florida Water ...

Create successful ePaper yourself
Turn your PDF publications into a flip-book with our unique Google optimized e-Paper software.
Flow reduction (% ) resulting in a 15% reduction in the number of<br />
days the flow is reached<br />
30<br />
25<br />
20<br />
15<br />
10<br />
5<br />
0<br />
0 500 1000 1500 2000 2500 3000 3500<br />
Flow at USGS Alafia River at Lithia gage (cfs)<br />
Flow reduction (%) resulting in a 15% reduction in the number of<br />
days the flow is reached<br />
30<br />
25<br />
20<br />
15<br />
10<br />
5<br />
0<br />
0 1000 2000 3000 4000 5000 6000 7000<br />
Flow at USGS Peace River near Arcadia Gage (cfs)<br />
Flow reduction (%) resulting in a 15% reduction in the number o<br />
days the flow is reached<br />
30<br />
25<br />
20<br />
15<br />
10<br />
5<br />
0<br />
0 500 1000 1500 2000 2500<br />
Flow at USGS Myakka near Sarasota Gage (cfs)<br />
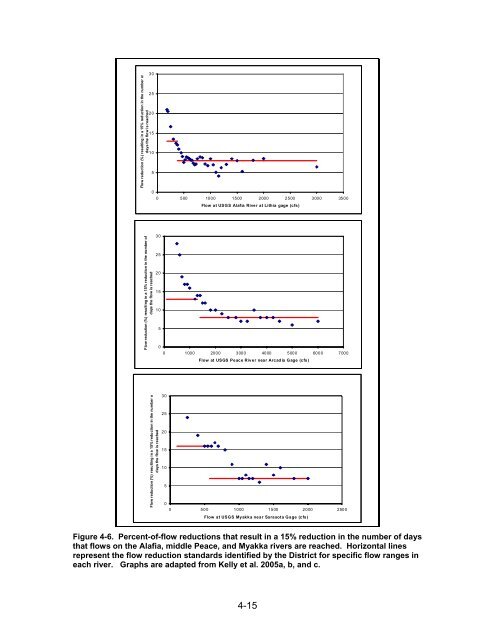
Figure 4-6. Percent-of-flow reductions that result in a 15% reduction in the number of days<br />
that flows on the Alafia, middle Peace, <strong>and</strong> Myakka rivers are reached. Horizontal lines<br />
represent the flow reduction st<strong>and</strong>ards identified by the District for specific flow ranges in<br />
each river. Graphs are adapted from Kelly et al. 2005a, b, <strong>and</strong> c.<br />
4-15


