Living with Risk. A global review of disaster reduction initiatives
Living with Risk. A global review of disaster reduction initiatives
Living with Risk. A global review of disaster reduction initiatives

Create successful ePaper yourself
Turn your PDF publications into a flip-book with our unique Google optimized e-Paper software.
consideration about the nature <strong>of</strong> impacts and<br />
the severity <strong>of</strong> various consequences <strong>of</strong> different<br />
hazards on affected populations.<br />
Hazard mapping, awareness<br />
and public policy<br />
A key dimension <strong>of</strong> hazard assessment is the<br />
presentation <strong>of</strong> the results and the understanding<br />
<strong>of</strong> the added value by policy makers. Maps<br />
can be prepared manually using standard cartographic<br />
techniques or <strong>with</strong> a GIS. Different<br />
types <strong>of</strong> hazards will require different mapping<br />
techniques. The importance lies in the easy<br />
understanding and use <strong>of</strong> the information generated.<br />
For example, maps are the standart format for<br />
presenting flood hazards. The flood-hazard<br />
areas are usually divided according to severity<br />
(deep or shallow), type (quiet water or high<br />
velocity) or frequency. In the case <strong>of</strong> volcanic<br />
hazards, the zoning <strong>of</strong> each direct and indirect<br />
hazards can be drawn according to the intensity,<br />
the extent <strong>of</strong> the hazard, the frequency <strong>of</strong><br />
occurrence or in combination. Composite phenomena<br />
and hazard maps are recognised as an<br />
important tool for joint hazard assessments.<br />
These combined hazard assessments need to<br />
be presented using a simple classification, such<br />
as high, medium and low risk, or no danger.<br />
One <strong>of</strong> the constraining factors in hazard<br />
mapping is not so much the lack <strong>of</strong> infrastructure<br />
but the lack <strong>of</strong> proper training capabilities.<br />
There are many government employees<br />
that do not have computer access . Hazard<br />
maps are also not as widely used as they could<br />
<strong>Risk</strong> awareness and assessment<br />
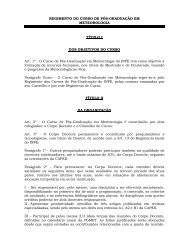
Several <strong>initiatives</strong> on hazard mapping were developed<br />
during the 1990s, as part <strong>of</strong> IDNDR. One example is<br />
the “Eastern Asia Natural Hazards Mapping Project”<br />
(EANHMP), started in Japan in 1994. The objectives<br />
<strong>of</strong> the project were to enhance awareness on natural<br />
hazards, in particular geological hazards among planners<br />
and policy makers <strong>of</strong> national and regional development,<br />
as well as general public in a given region,<br />
promote scientific studies on geological hazards, and<br />
transfer technology on hazard mapping to developing<br />
countries through collaborative activities. The Eastern<br />
Asia Geological Hazards Map is one <strong>of</strong> the products<br />
already available.<br />
Source: Geological Survey <strong>of</strong> Japan, AIST, 2002<br />
be, were more planners and decision-makers<br />
aware <strong>of</strong> their potential. For example, in<br />
Bangladesh, while many different entities are<br />
carrying out various projects in risk and hazard<br />
mapping and land-use planning, there<br />
exists no common focal point for easy access to<br />
this information. Moreover, communication is<br />
deficient : maps are not shared, and data is<br />
collected several times, or mismanaged.<br />
Vulnerability and capacity assessment<br />
Vulnerability and capacity assessments are an<br />
indispensable complement to hazard assessment<br />
exercises. Despite the considerable efforts<br />
and achievements reflected in improved quality<br />
and coverage <strong>of</strong> scientific data on different<br />
hazards, the mapping and assessing <strong>of</strong> social,<br />
economic and environmental vulnerabilities <strong>of</strong><br />
the population are not equally developed. Some<br />
2<br />
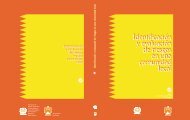
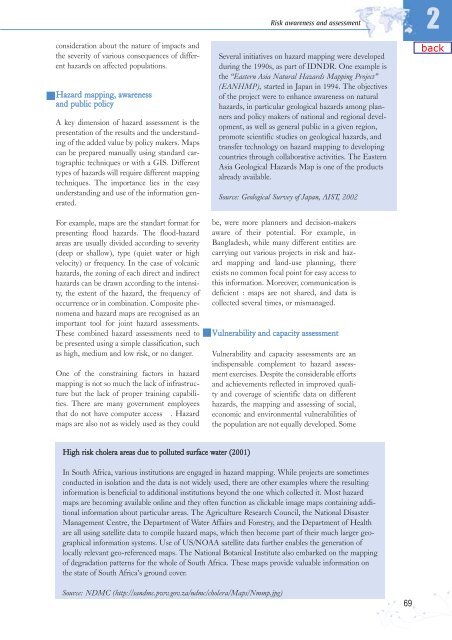
High risk cholera areas due to polluted surface water (2001)<br />
In South Africa, various institutions are engaged in hazard mapping. While projects are sometimes<br />
conducted in isolation and the data is not widely used, there are other examples where the resulting<br />
information is beneficial to additional institutions beyond the one which collected it. Most hazard<br />
maps are becoming available online and they <strong>of</strong>ten function as clickable image maps containing additional<br />
information about particular areas. The Agriculture Research Council, the National Disaster<br />
Management Centre, the Department <strong>of</strong> Water Affairs and Forestry, and the Department <strong>of</strong> Health<br />
are all using satellite data to compile hazard maps, which then become part <strong>of</strong> their much larger geographical<br />
information systems. Use <strong>of</strong> US/NOAA satellite data further enables the generation <strong>of</strong><br />
locally relevant geo-referenced maps. The National Botanical Institute also embarked on the mapping<br />
<strong>of</strong> degradation patterns for the whole <strong>of</strong> South Africa. These maps provide valuable information on<br />
the state <strong>of</strong> South Africa’s ground cover.<br />
Source: NDMC (http://sandmc.pwv.gov.za/ndmc/cholera/Maps/Nmmp.jpg)<br />
69