

ANNUAL REPORT 2004 - Skanska
ANNUAL REPORT 2004 - Skanska
ANNUAL REPORT 2004 - Skanska

You also want an ePaper? Increase the reach of your titles
YUMPU automatically turns print PDFs into web optimized ePapers that Google loves.
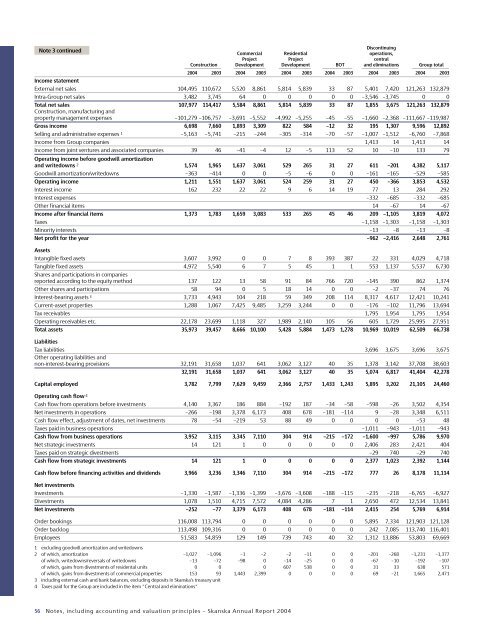
Note 3 continued<br />
Discontinuing<br />
Commercial Residential operations,<br />
Project Project central<br />
Construction Development Development BOT and eliminations Group total<br />
<strong>2004</strong> 2003 <strong>2004</strong> 2003 <strong>2004</strong> 2003 <strong>2004</strong> 2003 <strong>2004</strong> 2003 <strong>2004</strong> 2003<br />
Income statement<br />
External net sales 104,495 110,672 5,520 8,861 5,814 5,839 33 87 5,401 7,420 121,263 132,879<br />
Intra-Group net sales 3,482 3,745 64 0 0 0 0 0 –3,546 –3,745 0 0<br />
Total net sales 107,977 114,417 5,584 8,861 5,814 5,839 33 87 1,855 3,675 121,263 132,879<br />
Construction, manufacturing and<br />
property management expenses –101,279 –106,757 –3,691 –5,552 –4,992 –5,255 –45 –55 –1,660 –2,368 –111,667 –119,987<br />
Gross income 6,698 7,660 1,893 3,309 822 584 –12 32 195 1,307 9,596 12,892<br />
Selling and administrative expenses 1 –5,163 –5,741 –215 –244 –305 –314 –70 –57 –1,007 –1,512 –6,760 –7,868<br />
Income from Group companies 1,413 14 1,413 14<br />
Income from joint ventures and associated companies 39 46 –41 –4 12 –5 113 52 10 –10 133 79<br />
Operating income before goodwill amortization<br />
and writedowns 2 1,574 1,965 1,637 3,061 529 265 31 27 611 –201 4,382 5,117<br />
Goodwill amortization/writedowns –363 –414 0 0 –5 –6 0 0 –161 –165 –529 –585<br />
Operating income 1,211 1,551 1,637 3,061 524 259 31 27 450 –366 3,853 4,532<br />
Interest income 162 232 22 22 9 6 14 19 77 13 284 292<br />
Interest expenses –332 –685 –332 –685<br />
Other financial items 14 –67 14 –67<br />
Income after financial items 1,373 1,783 1,659 3,083 533 265 45 46 209 –1,105 3,819 4,072<br />
Taxes –1,158 –1,303 –1,158 –1,303<br />
Minority interests –13 –8 –13 –8<br />
Net profit for the year –962 –2,416 2,648 2,761<br />
Assets<br />
Intangible fixed asets 3,607 3,992 0 0 7 8 393 387 22 331 4,029 4,718<br />
Tangible fixed assets 4,972 5,540 6 7 5 45 1 1 553 1,137 5,537 6,730<br />
Shares and participations in companies<br />
reported according to the equity method 137 122 13 58 91 84 766 720 –145 390 862 1,374<br />
Other shares and participations 58 94 0 5 18 14 0 0 –2 –37 74 76<br />
Interest-bearing assets 3 3,733 4,943 104 218 59 349 208 114 8,317 4,617 12,421 10,241<br />
Current-asset properties 1,288 1,067 7,425 9,485 3,259 3,244 0 0 –176 –102 11,796 13,694<br />
Tax receivables 1,795 1,954 1,795 1,954<br />
Operating receivables etc. 22,178 23,699 1,118 327 1,989 2,140 105 56 605 1,729 25,995 27,951<br />
Total assets 35,973 39,457 8,666 10,100 5,428 5,884 1,473 1,278 10,969 10,019 62,509 66,738<br />
Liabilities<br />
Tax liabilities 3,696 3,675 3,696 3,675<br />
Other operating liabilities and<br />
non-interest-bearing provisions 32,191 31,658 1,037 641 3,062 3,127 40 35 1,378 3,142 37,708 38,603<br />
32,191 31,658 1,037 641 3,062 3,127 40 35 5,074 6,817 41,404 42,278<br />
Capital employed 3,782 7,799 7,629 9,459 2,366 2,757 1,433 1,243 5,895 3,202 21,105 24,460<br />
Operating cash flow 4<br />
Cash flow from operations before investments 4,140 3,367 186 884 –192 187 –34 –58 –598 –26 3,502 4,354<br />
Net investments in operations –266 –198 3,378 6,173 408 678 –181 –114 9 –28 3,348 6,511<br />
Cash flow effect, adjustment of dates, net investments 78 –54 –219 53 88 49 0 0 0 0 –53 48<br />
Taxes paid in business operations –1,011 –943 –1,011 –943<br />
Cash flow from business operations 3,952 3,115 3,345 7,110 304 914 –215 –172 –1,600 –997 5,786 9,970<br />
Net strategic investments 14 121 1 0 0 0 0 0 2,406 283 2,421 404<br />
Taxes paid on strategic divestments –29 740 –29 740<br />
Cash flow from strategic investments 14 121 1 0 0 0 0 0 2,377 1,023 2,392 1,144<br />
Cash flow before financing activities and dividends 3,966 3,236 3,346 7,110 304 914 –215 –172 777 26 8,178 11,114<br />
Net investments<br />
Investments –1,330 –1,587 –1,336 –1,399 –3,676 –3,608 –188 –115 –235 –218 –6,765 –6,927<br />
Divestments 1,078 1,510 4,715 7,572 4,084 4,286 7 1 2,650 472 12,534 13,841<br />
Net investments –252 –77 3,379 6,173 408 678 –181 –114 2,415 254 5,769 6,914<br />
Order bookings 116,008 113,794 0 0 0 0 0 0 5,895 7,334 121,903 121,128<br />
Order backlog 113,498 109,316 0 0 0 0 0 0 242 7,085 113,740 116,401<br />
Employees 51,583 54,859 129 149 739 743 40 32 1,312 13,886 53,803 69,669<br />
1 excluding goodwill amortization and writedowns<br />
2 of which, amortization –1,027 –1,096 –1 –2 –2 –11 0 0 –201 –268 –1,231 –1,377<br />
of which, writedowns/reversals of writedowns –13 –72 –98 0 –14 –25 0 0 –67 –10 –192 –107<br />
of which, gains from divestments of residental units 0 0 0 607 538 0 0 31 33 638 571<br />
of which, gains from divestments of commercial properties 153 93 1,443 2,399 0 0 0 0 69 –21 1,665 2,471<br />
3 including external cash and bank balances, excluding deposits in <strong>Skanska</strong>’s treasury unit<br />
4 Taxes paid for the Group are included in the item ”Central and eliminations”<br />
56 Notes, including accounting and valuation principles – <strong>Skanska</strong> Annual Report <strong>2004</strong>


