

ANNUAL REPORT 2004 - Skanska
ANNUAL REPORT 2004 - Skanska
ANNUAL REPORT 2004 - Skanska

Create successful ePaper yourself
Turn your PDF publications into a flip-book with our unique Google optimized e-Paper software.
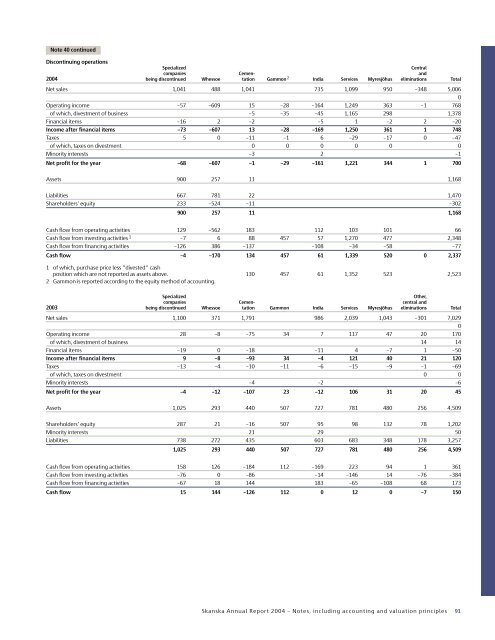
Note 40 continued<br />
Discontinuing operations<br />
Specialized<br />
Central<br />
companies Cemen- and<br />
<strong>2004</strong> being discontinued Whessoe tation Gammon 2 India Services Myresjöhus eliminations Total<br />
Net sales 1,041 488 1,041 735 1,099 950 –348 5,006<br />
0<br />
Operating income –57 –609 15 –28 –164 1,249 363 –1 768<br />
of which, divestment of business –5 –35 –45 1,165 298 1,378<br />
Financial items –16 2 –2 –5 1 –2 2 –20<br />
Income after financial items –73 –607 13 –28 –169 1,250 361 1 748<br />
Taxes 5 0 –11 –1 6 –29 –17 0 –47<br />
of which, taxes on divestment 0 0 0 0 0 0<br />
Minority interests –3 2 –1<br />
Net profit for the year –68 –607 –1 –29 –161 1,221 344 1 700<br />
Assets 900 257 11 1,168<br />
Liabilities 667 781 22 1,470<br />
Shareholders’ equity 233 –524 –11 –302<br />
900 257 11 1,168<br />
Cash flow from operating activities 129 –562 183 112 103 101 66<br />
Cash flow from investing activities 1 –7 6 88 457 57 1,270 477 2,348<br />
Cash flow from financing activities –126 386 –137 –108 –34 –58 –77<br />
Cash flow –4 –170 134 457 61 1,339 520 0 2,337<br />
1 of which, purchase price less ”divested” cash<br />
position which are not reported as assets above. 130 457 61 1,352 523 2,523<br />
2 Gammon is reported according to the equity method of accounting.<br />
Specialized<br />
Other,<br />
companies Cemen- central and<br />
2003 being discontinued Whessoe tation Gammon India Services Myresjöhus eliminations Total<br />
Net sales 1,100 371 1,791 986 2,039 1,043 –301 7,029<br />
0<br />
Operating income 28 –8 –75 34 7 117 47 20 170<br />
of which, divestment of business 14 14<br />
Financial items –19 0 –18 –11 4 –7 1 –50<br />
Income after financial items 9 –8 –93 34 –4 121 40 21 120<br />
Taxes –13 –4 –10 –11 –6 –15 –9 –1 –69<br />
of which, taxes on divestment 0 0<br />
Minority interests –4 –2 –6<br />
Net profit for the year –4 –12 –107 23 –12 106 31 20 45<br />
Assets 1,025 293 440 507 727 781 480 256 4,509<br />
Shareholders’ equity 287 21 –16 507 95 98 132 78 1,202<br />
Minority interests 21 29 50<br />
Liabilities 738 272 435 603 683 348 178 3,257<br />
1,025 293 440 507 727 781 480 256 4,509<br />
Cash flow from operating activities 158 126 –184 112 –169 223 94 1 361<br />
Cash flow from investing activities –76 0 –86 –14 –146 14 –76 –384<br />
Cash flow from financing activities –67 18 144 183 –65 –108 68 173<br />
Cash flow 15 144 –126 112 0 12 0 –7 150<br />
<strong>Skanska</strong> Annual Report <strong>2004</strong> – Notes, including accounting and valuation principles<br />
91


