

download the mexico energy revolution scenario
download the mexico energy revolution scenario
download the mexico energy revolution scenario

Create successful ePaper yourself
Turn your PDF publications into a flip-book with our unique Google optimized e-Paper software.
WORLD ENERGY [R]EVOLUTION<br />
A SUSTAINABLE ENERGY OUTLOOK<br />
2<br />
implementing <strong>the</strong> <strong>energy</strong> [r]evolution | GREENHOUSE DEVELOPMENT RIGHTS<br />
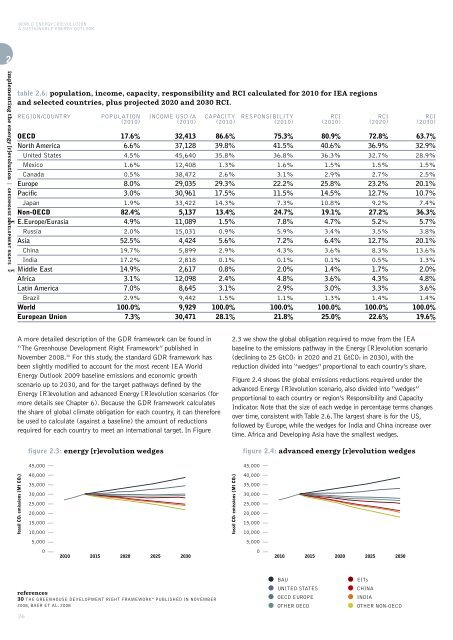
table 2.6: population, income, capacity, responsibility and RCI calculated for 2010 for IEA regions<br />
and selected countries, plus projected 2020 and 2030 RCI.<br />
REGION/COUNTRY<br />
OECD<br />
North America<br />
United States<br />
Mexico<br />
Canada<br />
Europe<br />
Pacific<br />
Japan<br />
Non-OECD<br />
E.Europe/Eurasia<br />
Russia<br />
Asia<br />
China<br />
India<br />
Middle East<br />
Africa<br />
Latin America<br />
Brazil<br />
World<br />
European Union<br />
POPULATION<br />
(2010)<br />
17.6%<br />
6.6%<br />
4.5%<br />
1.6%<br />
0.5%<br />
8.0%<br />
3.0%<br />
1.9%<br />
82.4%<br />
4.9%<br />
2.0%<br />
52.5%<br />
19.7%<br />
17.2%<br />
14.9%<br />
3.1%<br />
7.0%<br />
2.9%<br />
100.0%<br />
7.3%<br />
INCOME USD /A<br />
(2010)<br />
32,413<br />
37,128<br />
45,640<br />
12,408<br />
38,472<br />
29,035<br />
30,961<br />
33,422<br />
5,137<br />
11,089<br />
15,031<br />
4,424<br />
5,899<br />
2,818<br />
2,617<br />
12,098<br />
8,645<br />
9,442<br />
9,929<br />
30,471<br />
CAPACITY<br />
(2010)<br />
86.6%<br />
39.8%<br />
35.8%<br />
1.3%<br />
2.6%<br />
29.3%<br />
17.5%<br />
14.3%<br />
13.4%<br />
1.5%<br />
0.9%<br />
5.6%<br />
2.9%<br />
0.1%<br />
0.8%<br />
2.4%<br />
3.1%<br />
1.5%<br />
100.0%<br />
28.1%<br />
RESPONSIBILITY<br />
(2010)<br />
75.3%<br />
41.5%<br />
36.8%<br />
1.6%<br />
3.1%<br />
22.2%<br />
11.5%<br />
7.3%<br />
24.7%<br />
7.8%<br />
5.9%<br />
7.2%<br />
4.3%<br />
0.1%<br />
2.0%<br />
4.8%<br />
2.9%<br />
1.1%<br />
100.0%<br />
21.8%<br />
RCI<br />
(2010)<br />
80.9%<br />
40.6%<br />
36.3%<br />
1.5%<br />
2.9%<br />
25.8%<br />
14.5%<br />
10.8%<br />
19.1%<br />
4.7%<br />
3.4%<br />
6.4%<br />
3.6%<br />
0.1%<br />
1.4%<br />
3.6%<br />
3.0%<br />
1.3%<br />
100.0%<br />
25.0%<br />
RCI<br />
(2020)<br />
72.8%<br />
36.9%<br />
32.7%<br />
1.5%<br />
2.7%<br />
23.2%<br />
12.7%<br />
9.2%<br />
27.2%<br />
5.2%<br />
3.5%<br />
12.7%<br />
8.3%<br />
0.5%<br />
1.7%<br />
4.3%<br />
3.3%<br />
1.4%<br />
100.0%<br />
22.6%<br />
RCI<br />
(2030)<br />
63.7%<br />
32.9%<br />
28.9%<br />
1.5%<br />
2.5%<br />
20.1%<br />
10.7%<br />
7.4%<br />
36.3%<br />
5.7%<br />
3.8%<br />
20.1%<br />
13.6%<br />
1.3%<br />
2.0%<br />
4.8%<br />
3.6%<br />
1.4%<br />
100.0%<br />
19.6%<br />
A more detailed description of <strong>the</strong> GDR framework can be found in<br />
“The Greenhouse Development Right Framework” published in<br />
November 2008. 30 For this study, <strong>the</strong> standard GDR framework has<br />
been slightly modified to account for <strong>the</strong> most recent IEA World<br />
Energy Outlook 2009 baseline emissions and economic growth<br />
<strong>scenario</strong> up to 2030, and for <strong>the</strong> target pathways defined by <strong>the</strong><br />
Energy [R]evolution and advanced Energy [R]evolution <strong>scenario</strong>s (for<br />
more details see Chapter 6). Because <strong>the</strong> GDR framework calculates<br />
<strong>the</strong> share of global climate obligation for each country, it can <strong>the</strong>refore<br />
be used to calculate (against a baseline) <strong>the</strong> amount of reductions<br />
required for each country to meet an international target. In Figure<br />
figure 2.3: <strong>energy</strong> [r]evolution wedges<br />
2.3 we show <strong>the</strong> global obligation required to move from <strong>the</strong> IEA<br />
baseline to <strong>the</strong> emissions pathway in <strong>the</strong> Energy [R]evolution <strong>scenario</strong><br />
(declining to 25 GtCO2 in 2020 and 21 GtCO2 in 2030), with <strong>the</strong><br />
reduction divided into “wedges” proportional to each country’s share.<br />
Figure 2.4 shows <strong>the</strong> global emissions reductions required under <strong>the</strong><br />
advanced Energy [R]evolution <strong>scenario</strong>, also divided into “wedges”<br />
proportional to each country or region’s Responsibility and Capacity<br />
Indicator. Note that <strong>the</strong> size of each wedge in percentage terms changes<br />
over time, consistent with Table 2.6. The largest share is for <strong>the</strong> US,<br />
followed by Europe, while <strong>the</strong> wedges for India and China increase over<br />
time. Africa and Developing Asia have <strong>the</strong> smallest wedges.<br />
figure 2.4: advanced <strong>energy</strong> [r]evolution wedges<br />
45,000<br />
45,000<br />
fossil CO2 emissions (Mt CO2)<br />
40,000<br />
35,000<br />
30,000<br />
25,000<br />
20,000<br />
15,000<br />
10,000<br />
fossil CO2 emissions (Mt CO2)<br />
40,000<br />
35,000<br />
30,000<br />
25,000<br />
20,000<br />
15,000<br />
10,000<br />
5,000<br />
5,000<br />
0<br />
2010 2015 2020 2025 2030<br />
0<br />
2010 2015 2020 2025 2030<br />
references<br />
30 THE GREENHOUSE DEVELOPMENT RIGHT FRAMEWORK” PUBLISHED IN NOVEMBER<br />
2008, BAER ET AL. 2008<br />
26<br />
BAU<br />
UNITED STATES<br />
•<br />
OECD EUROPE<br />
OTHER OECD<br />
EITs<br />
CHINA<br />
• INDIA<br />
OTHER NON-OECD
![Energy [R]evolution - European Commission](https://img.yumpu.com/49109324/1/184x260/energy-revolution-european-commission.jpg?quality=85)
![5905 gp [eu rev]csfr4.qxd - Energy [R]evolution](https://img.yumpu.com/42305023/1/184x260/5905-gp-eu-revcsfr4qxd-energy-revolution.jpg?quality=85)

![5905 gp [eu rev]csfr4.qxd - Energy [R]evolution](https://img.yumpu.com/28729264/1/184x260/5905-gp-eu-revcsfr4qxd-energy-revolution.jpg?quality=85)