

download the mexico energy revolution scenario
download the mexico energy revolution scenario
download the mexico energy revolution scenario

Create successful ePaper yourself
Turn your PDF publications into a flip-book with our unique Google optimized e-Paper software.
WORLD ENERGY [R]EVOLUTION<br />
A SUSTAINABLE ENERGY OUTLOOK<br />
5<br />
<strong>scenario</strong>s for a future <strong>energy</strong> supply | OIL AND GAS PROJECTIONS<br />
1. oil and gas price projections<br />
The recent dramatic fluctuations in global oil prices have resulted in<br />
slightly higher forward price projections for fossil fuels. Under <strong>the</strong> 2004<br />
‘high oil and gas price’ <strong>scenario</strong> from <strong>the</strong> European Commission, for<br />
example, an oil price of just $34 per barrel was assumed in 2030.<br />
More recent projections of oil prices by 2030 in <strong>the</strong> IEA’s WEO 2009<br />
range from $2008 80/bbl in <strong>the</strong> lower prices sensitivity case up to<br />
$2008 150/bbl in <strong>the</strong> higher prices sensitivity case. The reference<br />
<strong>scenario</strong> in WEO 2009 predicts an oil price of $2008 115/bbl.<br />
Since <strong>the</strong> first Energy [R]evolution study was published in 2007,<br />
however, <strong>the</strong> actual price of oil has moved over $100/bbl for <strong>the</strong> first<br />
time, and in July 2008 reached a record high of more than $140/bbl.<br />
Although oil prices fell back to $100/bbl in September 2008 and<br />
around $80/bbl in April 2010 <strong>the</strong> projections in <strong>the</strong> IEA reference<br />
<strong>scenario</strong> might still be considered too conservative. Taking into account<br />
<strong>the</strong> growing global demand for oil we have assumed a price<br />
development path for fossil fuels based on <strong>the</strong> IEA WEO 2009 higher<br />
prices sensitivity case extrapolated forward to 2050 (see Table 5.3).<br />
As <strong>the</strong> supply of natural gas is limited by <strong>the</strong> availability of pipeline<br />
infrastructure, <strong>the</strong>re is no world market price for gas. In most regions<br />
of <strong>the</strong> world <strong>the</strong> gas price is directly tied to <strong>the</strong> price of oil. Gas prices<br />
are <strong>the</strong>refore assumed to increase to $24-29/GJ by 2050.<br />
2. cost of CO2 emissions<br />
Assuming that a CO2 emissions trading system is established across<br />
all world regions in <strong>the</strong> longer term, <strong>the</strong> cost of CO2 allowances<br />
needs to be included in <strong>the</strong> calculation of electricity generation<br />
costs. Projections of emissions costs are even more uncertain than<br />
<strong>energy</strong> prices, however, and available studies span a broad range of<br />
future estimates. As in <strong>the</strong> previous Energy [R]evolution study we<br />
assume CO2 costs of $10/tCO2 in 2015, rising to $50/tCO2 by 2050.<br />
Additional CO2 costs are applied in Kyoto Protocol Non-Annex B<br />
(developing) countries only after 2020.<br />
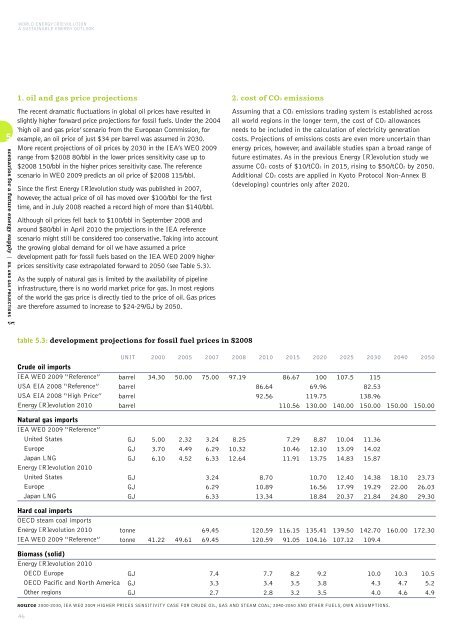
table 5.3: development projections for fossil fuel prices in $2008<br />
Crude oil imports<br />
IEA WEO 2009 “Reference”<br />
USA EIA 2008 “Reference”<br />
USA EIA 2008 “High Price”<br />
Energy [R]evolution 2010<br />
UNIT<br />
barrel<br />
barrel<br />
barrel<br />
barrel<br />
2000<br />
34.30<br />
2005<br />
50.00<br />
2007<br />
75.00<br />
2008<br />
97.19<br />
2010<br />
86.64<br />
92.56<br />
2015<br />
86.67<br />
110.56<br />
2020<br />
100<br />
69.96<br />
119.75<br />
130.00<br />
2025<br />
107.5<br />
140.00<br />
2030<br />
115<br />
82.53<br />
138.96<br />
150.00<br />
2040<br />
150.00<br />
2050<br />
150.00<br />
Natural gas imports<br />
IEA WEO 2009 “Reference”<br />
United States<br />
Europe<br />
Japan LNG<br />
Energy [R]evolution 2010<br />
United States<br />
Europe<br />
Japan LNG<br />
GJ<br />
GJ<br />
GJ<br />
GJ<br />
GJ<br />
GJ<br />
5.00<br />
3.70<br />
6.10<br />
2.32<br />
4.49<br />
4.52<br />
3.24<br />
6.29<br />
6.33<br />
3.24<br />
6.29<br />
6.33<br />
8.25<br />
10.32<br />
12.64<br />
8.70<br />
10.89<br />
13.34<br />
7.29<br />
10.46<br />
11.91<br />
8.87<br />
12.10<br />
13.75<br />
10.70<br />
16.56<br />
18.84<br />
10.04<br />
13.09<br />
14.83<br />
12.40<br />
17.99<br />
20.37<br />
11.36<br />
14.02<br />
15.87<br />
14.38<br />
19.29<br />
21.84<br />
18.10<br />
22.00<br />
24.80<br />
23.73<br />
26.03<br />
29.30<br />
Hard coal imports<br />
OECD steam coal imports<br />
Energy [R]evolution 2010<br />
IEA WEO 2009 “Reference”<br />
tonne<br />
tonne<br />
41.22<br />
49.61<br />
69.45<br />
69.45<br />
120.59<br />
120.59<br />
116.15<br />
91.05<br />
135.41<br />
104.16<br />
139.50<br />
107.12<br />
142.70<br />
109.4<br />
160.00<br />
172.30<br />
Biomass (solid)<br />
Energy [R]evolution 2010<br />
OECD Europe<br />
OECD Pacific and North America<br />
O<strong>the</strong>r regions<br />
GJ<br />
GJ<br />
GJ<br />
7.4<br />
3.3<br />
2.7<br />
7.7<br />
3.4<br />
2.8<br />
8.2<br />
3.5<br />
3.2<br />
9.2<br />
3.8<br />
3.5<br />
10.0<br />
4.3<br />
4.0<br />
10.3<br />
4.7<br />
4.6<br />
10.5<br />
5.2<br />
4.9<br />
source 2000-2030, IEA WEO 2009 HIGHER PRICES SENSITIVITY CASE FOR CRUDE OIL, GAS AND STEAM COAL; 2040-2050 AND OTHER FUELS, OWN ASSUMPTIONS.<br />
46
![Energy [R]evolution - European Commission](https://img.yumpu.com/49109324/1/184x260/energy-revolution-european-commission.jpg?quality=85)
![5905 gp [eu rev]csfr4.qxd - Energy [R]evolution](https://img.yumpu.com/42305023/1/184x260/5905-gp-eu-revcsfr4qxd-energy-revolution.jpg?quality=85)

![5905 gp [eu rev]csfr4.qxd - Energy [R]evolution](https://img.yumpu.com/28729264/1/184x260/5905-gp-eu-revcsfr4qxd-energy-revolution.jpg?quality=85)