Xstrata Copper North Queensland.pdf - Mount Isa Mines
Xstrata Copper North Queensland.pdf - Mount Isa Mines
Xstrata Copper North Queensland.pdf - Mount Isa Mines

You also want an ePaper? Increase the reach of your titles
YUMPU automatically turns print PDFs into web optimized ePapers that Google loves.
Environmental performance<br />
Environmental incidents<br />
and compliance<br />
EHM had no environmental incidents greater<br />
than Category 1 (negligible) in 2010.<br />
In August 2010, EHM was fined $100,000 by<br />
the Department of Environment and Resource<br />
Management (DERM) as a result of an<br />
extreme rainfall event that occurred in 2009<br />
that contributed to the release of stormwater<br />
that did not comply with the water quality<br />
limits in the EHM Environmental Authority<br />
Conditions (electrical conductivity (salinity)<br />
and sulphate levels were slightly above<br />
permitted limits).<br />
There was one non-compliance with the EHM<br />
Environmental Authority licence conditions in<br />
2010. This was related to an adjustment to a<br />
Financial Assurance bond required by DERM.<br />
Climate change<br />
Carbon emissions<br />
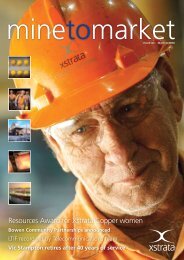
In 2010, EHM’s total greenhouse gas<br />
emissions was 246,000 tonnes of carbon<br />
dioxide equivalents (CO 2 -e) up from the 2009<br />
total of 201,000 tonnes of CO 2 -e. Carbon<br />
intensity for the site in 2010 was 0.03 tonnes<br />
of CO 2 -e per tonne of ore processed, the<br />
same intensity as 2009.<br />
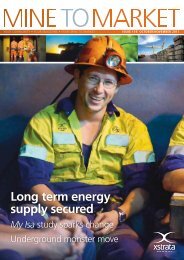
Clockwise from top: Lil Howarth – Environmental Advisor, conducts an Environmental Audit<br />
with David Tempany from Hastings Deering in EHM’s heavy vehicle workshop<br />
A water bird at EHM<br />
EHM’s rehabilitated south waste rock dump<br />
EHM’s total greenhouse gas emissions are<br />
comprised of direct and indirect emissions<br />
(refer to the Energy use by source table on<br />
this page). In 2010, EHM’s direct emissions<br />
accounted for 124,500 tonnes of the total<br />
CO 2 -e greenhouse gas emissions, compared<br />
to 89,000 tonnes of CO 2 -e in 2009. Indirect<br />
emissions accounted for 122,000 tonnes of<br />
CO 2 -e of the total greenhouse gas emissions,<br />
compared to 112,000 tonnes of CO 2 -e<br />
in 2009.<br />
As a proportion of total energy used, the<br />
ratio of diesel to power use increased in<br />
2010. As the combustion of diesel produces<br />
less CO 2 -e emissions per unit of energy than<br />
the generation of power, this meant that<br />
while energy intensity increased, carbon<br />
intensity as a proportion of total production<br />
was stable. The increase in the proportion of<br />
diesel consumption was due to the need to<br />
go deeper into the pit (longer haul distance)<br />
to extract ore.<br />
Greenhouse gas emissions – EHM<br />
‘000s tonnes CO 2 -e<br />
450<br />
375<br />
300<br />
225<br />
150<br />
75<br />
0<br />
247<br />
231<br />
224<br />
201<br />
246<br />
2006 2007 2008 2009 2010<br />
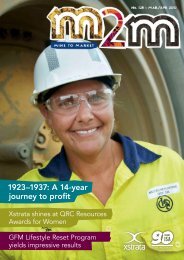
Carbon intensity – EHM<br />
Tonnes CO 2 -e per tonne ore processed<br />
0.06<br />
0.05<br />
0.04<br />
0.03<br />
0.02<br />
0.01<br />
0<br />
*Target<br />
0.02<br />
0.02<br />
0.02<br />
0.03<br />
0.03<br />
0.02<br />
2006 2007 2008 2009 2010 2011*<br />
Sustainability Report 2010 97