housing developments in european countries - Department of ...
housing developments in european countries - Department of ...
housing developments in european countries - Department of ...

You also want an ePaper? Increase the reach of your titles
YUMPU automatically turns print PDFs into web optimized ePapers that Google loves.
Section 1<br />
Introduction and Summary<br />
4 European Union Report<br />
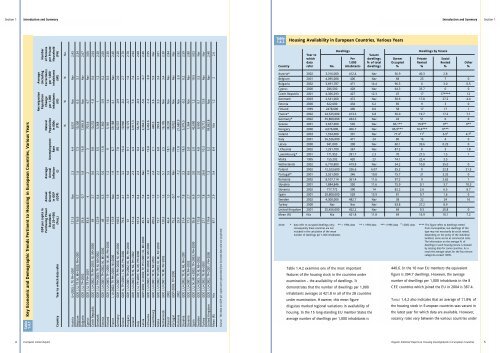
Table<br />
1.4.1<br />
Key Economic and Demographic Trends Pert<strong>in</strong>ent to Hous<strong>in</strong>g <strong>in</strong> European Countries, Various Years<br />
Net migration Average<br />
GDP per capita <strong>in</strong> Population (<strong>in</strong>clud<strong>in</strong>g Number<br />
Purchas<strong>in</strong>g Power Annual Average Natural Change Corrections) <strong>of</strong> Persons<br />
Standards Growth Annual Unemployment Population per 1,000 per 1,000 per Private<br />
(EU 25=100) <strong>in</strong> GDP Inflation Rate <strong>in</strong> 000s <strong>in</strong>habitants <strong>in</strong>habitants Household<br />
Country Year to which data refer (Proj.) (GDP) (I) (U) (TP) (NI) (MI) (PH)<br />
% % % No.<br />
Austria U=2003; I, TP, PH=2001 121.5 Nav 2.3 4.4 8,031 Nav Nav 2.43<br />
Belgium GDP, I, U, TP, NI, MI=2002; PH=2001 116.9 0.7 1.6 7.3 10,300 0.5 3.1 2.34<br />
Bulgaria GDP, I, U, TP=2002 29.6 -0.7 5.8 16.8 7,845.8 Nav Nav 2.67<br />
Cyprus GDP, I, U, TP, PH=2001 83.6 4 2 3 703.6 4.7 Nav 3.06<br />
Czech Republic GDP, I, U=2002; TP, PH=2001; NI, MI=2000 69 3.7 0.6 9.8 10,232 -1.8 0.6 2.64<br />
Denmark GDP, I, U, PH=2003; TP, NI, MI=2002 123.9 0.4 2.1 5.5 5,368 1 1.2 2.20<br />
Estonia GDP, I, U=2001; TP=2002; NI, MI=2000 49 6.5 5.6 11.8 1,360 -3.9 0.2 2.60<br />
F<strong>in</strong>land GDP, I, U=2003, TP =2001; NI, MI, PH=2000 110.5 1.9 1.2 9 5,181 1.4 0.5 2.30<br />
France I, U=2002; TP, PH=2001; NI=2000 113.9 Nav 1.9 8.7 59,188 4.1 Nav 2.40<br />
Germany GDP, I, U=2001; TP, PH=2002; NI, MI=2000 108.5 0.8 1.9 7.8 82,537 -0.9 2.0 2.20<br />
Greece GDP, U, TP=2001; I, NI, MI, PH=2000 79.8 4.1 3.2 10.4 10,940 -0.2 2.7 2.70<br />
Hungary GDP, I, U=2001, TP=2002; NI, MI, PH=2000 61 3.9 5.6 9.1 10,175 -3.7 1.6 2.70<br />
Ireland GDP, I, U=2003; TP, NI, MI, PH=2002 131.4 1.4 2.3 4.9 3,917.3 7.9 7.6 2.94<br />
Italy GDP, I, U, TP=2001; NI, MI, PH=2000 107.3 0.4 2.3 9.4 56,757 -0.3 3.1 2.60<br />
Latvia GDP=2002; U=2003; TP, PH=2001; NI, MI=2000 45.5 7.4 Nav 8.5 2,364.3 -5.0 -0.7 2.40<br />
Lithuania GDP, I, U=2002; TP, PH=2003; NI, MI=2000 46.1 6.8 -1.0 13.8 3,462.6 -1.4 -5.8 2.55<br />
Luxembourg GDP, I, U=2001; TP, NI, MI=2003 209.2 1.2 2.4 2.1 448.3 3.6 5.9 Nav<br />
Malta GDP, I, U=2002; TP=2003, NI, MI, PH=2000 73.7 1.7 2.2 6.8 399.8 3.3 3.4 3.01<br />
Netherlands GDP, I, U=2001; TP, MI, PH=2002 120.3 1.2 5.1 2.5 16,105 Nav 3.4 2.30<br />
Poland 2002 46.4 1.3 5.5 18.1 38,230 Nav Nav 2.84<br />
Portugal GDP=2003, TP=2000 75.2 -0.7 Nav Nav 10,022 Nav Nav Nav<br />
Romania 2002 29.9 0 -7.2 11.8 21,680.9 Nav -5.0 2.92<br />
Slovakia GDP, I, U=2002; TP, NI, MI, PH=2001 51.4 7.8 3.3 18.5 5,379.5 -0.2 0.2 2.59<br />
Slovenia GDP, I, U=2001; TP, PH=2002 77.3 2.7 8.6 5.8 1,964 Nav Nav 2.80<br />
Spa<strong>in</strong> GDP, I, U, NI, MI =2002; TP=2003; PH=2000 95.8 6.9 3.0 2.0 42,600 1.2 10.5 3.03<br />
Sweden GDP, I, U=2003, TP, NI, MI=2002 115.8 1.5 2.0 4.8 8,900 0.1 3.5 Nav<br />
Turkey GDP, I, U=2002; TP, NI=2003 27.1 7.8 26.0 10.3 70,712 13.9 Nav Nav<br />
United K<strong>in</strong>gdom GDP, I, U=2002; TP=2001; PH=2000 119.4 1.6 1.3 5.2 59,862.8 Nav Nav 2.40<br />
Mean (R) N/a 87.1 2.9 3.4 8.4 N/a 1.2 2 2.6<br />
Source: The data on GDP per capita were generated from Eurostat data and are projected.<br />
Introduction and Summary Section 1<br />
Table<br />
1.4.2<br />
Hous<strong>in</strong>g Availability <strong>in</strong> European Countries, Various Years<br />
Dwell<strong>in</strong>gs Dwell<strong>in</strong>gs by Tenure<br />
Year to Vacant<br />
which Per dwell<strong>in</strong>gs Owner Private Social<br />
data 1,000 % <strong>of</strong> total Occupied Rented Rented Other<br />
Country refer No. <strong>in</strong>habitants dwell<strong>in</strong>gs % % % %<br />
Austria* 2002 3,316,000 412.4 Nav 56.9 40.3 2.8<br />
Belgium 2001 4,095,008 400 Nav 68 25 7 0<br />
Bulgaria 2002 3,691,787 471 14.4 96.5 0 3.0 0.5<br />
Cyprus 2000 286,500 428 Nav 64.3 35.7 0 0<br />
Czech Republic 2001 4,366,293 427 12.3 47 17 17**** 12<br />
Denmark 2003 2,541,000 472 Nav 50.6 17.8 27.2 4.4<br />
Estonia 2000 622,600 434 6.2 85 9 3 0<br />
F<strong>in</strong>land 1999 2478,000 490 8.6 58 17 17 1<br />
France* 2002 24,525,000 413.3 6.8 56.0 19.7 17.2 7.1<br />
Germany* 2002 35,800,000 434.3 Nav 43 51 6 0<br />
Greece 2001 3,657,000 505 Nav 80.1** 19.9** 0** 0**<br />
Hungary 2000 4,076,800, 406.7 Nav 86.9*** 10.4*** 0***<br />
Ireland 2003 1,554,000 391 Nav 77.4 ∆ 11 ∆ 6.9 ∆ 4.7 ∆<br />
Italy 2001 26,526,000 471 24 80 16 4 0<br />
Latvia 2000 941,000 398 Nav 60.1 39.6 0.29 0<br />
Lithuania 2002 1,291,700 367 Nav 87.2 8 3 1.8<br />
Luxembourg* 2001 171,953 391.7 2.3 70 27.5 1.5 1<br />
Malta 1995 155,202 420 23 74.1 22.4 3.5<br />
Netherlands 2002 6,710,800 419.8 Nav 54.2 10.8 35.0 0<br />
Poland 2002 12,523,600 326.6 6.07 55.2 0 22.8 21.5<br />
Portugal* 2001 3,551,000 346 10.8 75.7 21 3.32 0<br />
Romania 2002 8,107,114 361.4 11.6 97.2 0 2.62 1<br />
Slovakia 2001 1,884,846 350 11.6 75.9 0.1 3.7 10.3<br />
Slovenia 2002 777,772 390 14 82.2 2.6 6.5 8.7<br />
Spa<strong>in</strong> 2001 20,800,000 528 13.9 81 9.7 1.6 0<br />
Sweden 2002 4,300,000 482.7 Nav 38 22 24 16<br />
Turkey 2000 Nav Nav Nav 63.8 27.2 8.9<br />
United K<strong>in</strong>gdom 2001 25,456,000 452.2 Nav 69 9.3 20.8 0<br />
Mean (R) N/a N/a 421.8 11.8 69 16.9 10.1 7.2<br />
Note: * data refer to occupied dwell<strong>in</strong>gs only; ** = 1994 data ** = 1994 data **** This figure refers to dwell<strong>in</strong>gs rented<br />
from municipalities, but dwell<strong>in</strong>gs <strong>of</strong> this<br />
type may not necessarily be social rented.<br />
Depend<strong>in</strong>g on the policy <strong>of</strong> the <strong>in</strong>dividual<br />
categories exceed 100%.<br />
result the average values for the four tenure<br />
by miss<strong>in</strong>g data for some <strong>countries</strong>. As a<br />
dwell<strong>in</strong>gs <strong>in</strong> each <strong>hous<strong>in</strong>g</strong> tenure is skewed<br />
The <strong>in</strong>formation on the average % <strong>of</strong><br />
landlord, some are let at commercial rents.<br />
number <strong>of</strong> dwell<strong>in</strong>gs per 1,000 <strong>in</strong>habitants. <strong>in</strong>cluded <strong>in</strong> the calculation <strong>of</strong> the mean consequently these <strong>countries</strong> are not *** =1996 data ∆ =2002 data Table 1.4.2 exam<strong>in</strong>es one <strong>of</strong> the most important<br />
features <strong>of</strong> the <strong>hous<strong>in</strong>g</strong> stock <strong>in</strong> the <strong>countries</strong> under<br />
exam<strong>in</strong>ation – the availability <strong>of</strong> dwell<strong>in</strong>gs. It<br />
demonstrates that the number <strong>of</strong> dwell<strong>in</strong>gs per 1,000<br />
440.6. In the 10 new EU members the equivalent<br />
figure is 394.7 dwell<strong>in</strong>gs. However, the average<br />
number <strong>of</strong> dwell<strong>in</strong>gs per 1,000 <strong>in</strong>habitants <strong>in</strong> the 8<br />
CEE <strong>countries</strong> which jo<strong>in</strong>ed the EU <strong>in</strong> 2004 is 387.4.<br />
<strong>in</strong>habitants averages at 421.8 <strong>in</strong> all <strong>of</strong> the 28 <strong>countries</strong><br />
under exam<strong>in</strong>ation. However, this mean figure<br />
disguises marked regional variations <strong>in</strong> availability <strong>of</strong><br />
<strong>hous<strong>in</strong>g</strong>. In the 15 long-stand<strong>in</strong>g EU member States the<br />
average number <strong>of</strong> dwell<strong>in</strong>gs per 1,000 <strong>in</strong>habitants is<br />
TABLE 1.4.2 also <strong>in</strong>dicates that an average <strong>of</strong> 11.8% <strong>of</strong><br />
the <strong>hous<strong>in</strong>g</strong> stock <strong>in</strong> European <strong>countries</strong> was vacant <strong>in</strong><br />
the latest year for which data are available. However,<br />
vacancy rates vary between the various <strong>countries</strong> under<br />
Regular National Report on Hous<strong>in</strong>g Developments <strong>in</strong> European Countries<br />
5