housing developments in european countries - Department of ...
housing developments in european countries - Department of ...
housing developments in european countries - Department of ...

You also want an ePaper? Increase the reach of your titles
YUMPU automatically turns print PDFs into web optimized ePapers that Google loves.
Section 2<br />
Context<br />
Context Section 2<br />
Table<br />
2.20.3<br />
Demographic Trends <strong>in</strong> the Netherlands,<br />
2000, 2002<br />
2.21 Poland<br />
2.21.2 Stock<br />
Table<br />
2.21.1<br />
Characteristics <strong>of</strong> the Hous<strong>in</strong>g Stock<br />
<strong>in</strong> Poland, 2002<br />
Category 2000 2002<br />
No.<br />
No.<br />
Population 15,864,000 16,105,000<br />
Household size 2.3 2.3<br />
Immigration 132,900 121,300<br />
Emigration 61,200 66,800<br />
Net migration 71,700 54,500<br />
2.20.3 Economy<br />
TABLE 2.20.2 sketches recent economic trends <strong>in</strong> the<br />
Netherlands. It reveals that annual growth <strong>in</strong> GDP <strong>in</strong><br />
this country has fallen from 3% <strong>in</strong> 1995 to 0.2% <strong>in</strong><br />
2002. At the same time the rate <strong>of</strong> <strong>in</strong>flation (as<br />
measured by annual change <strong>in</strong> the harmonised <strong>in</strong>dex <strong>of</strong><br />
consumer prices) has <strong>in</strong>creased from 1.4% <strong>in</strong> 1995 to<br />
5.1% <strong>in</strong> 2001, but unemployment has fallen to 2.5%<br />
<strong>of</strong> the labour force <strong>in</strong> 2001 – less than half the rate <strong>of</strong><br />
1995.<br />
2.20.4 Demography<br />
TABLE 2.20.3 provides details <strong>of</strong> recent demographic<br />
trends <strong>in</strong> the Netherlands. It reveals that the<br />
population <strong>of</strong> this country has <strong>in</strong>creased slightly <strong>in</strong><br />
recent years, from 15,864,000 people <strong>in</strong> 2000 to<br />
16,105,000 <strong>in</strong> 2002. This trend is a function <strong>of</strong><br />
positive net migration – immigrants <strong>in</strong>to the<br />
Netherlands exceeded emigrants by 54,500 persons <strong>in</strong><br />
2002. The average household size <strong>in</strong> the Netherlands<br />
has rema<strong>in</strong>ed stable <strong>in</strong> recent years – at around the<br />
average level among the <strong>countries</strong> exam<strong>in</strong>ed <strong>in</strong> this<br />
review.<br />
2.21.1 Policy Mak<strong>in</strong>g and<br />
Implementation<br />
Until 31 December 2003 responsibility for <strong>hous<strong>in</strong>g</strong><br />
policy implementation <strong>in</strong> Poland lay with the State<br />
Office for Hous<strong>in</strong>g and Urban Development (SOHUD)<br />
whose President reported to the M<strong>in</strong>ister <strong>of</strong><br />
Infrastructure. On 1 January 2004, the SOHUD was<br />
<strong>in</strong>corporated <strong>in</strong> the M<strong>in</strong>istry <strong>of</strong> Infrastructure which<br />
now holds responsibility for devis<strong>in</strong>g and<br />
implement<strong>in</strong>g <strong>hous<strong>in</strong>g</strong> policy <strong>in</strong> Poland.<br />
The scope <strong>of</strong> activity <strong>of</strong> the M<strong>in</strong>ister <strong>of</strong> Infrastructure<br />
<strong>in</strong> the <strong>hous<strong>in</strong>g</strong> sphere embraces the follow<strong>in</strong>g issues:<br />
■ implementation <strong>of</strong> <strong>hous<strong>in</strong>g</strong> policy;<br />
■ development and implementation <strong>of</strong> f<strong>in</strong>ancial tools<br />
for <strong>hous<strong>in</strong>g</strong> construction;<br />
■ implementation <strong>of</strong> spatial policy;<br />
■ preparation and implementation <strong>of</strong> effective urban<br />
development systems as well as legal <strong>in</strong>frastructure<br />
for management <strong>of</strong> the exist<strong>in</strong>g <strong>hous<strong>in</strong>g</strong> stock;<br />
■ preparation <strong>of</strong> the governmental programmes for<br />
development <strong>of</strong> the municipal <strong>in</strong>frastructure,<br />
and<br />
■ establishment <strong>of</strong> the rules <strong>of</strong> real estate<br />
management, <strong>in</strong>clud<strong>in</strong>g the formulation <strong>of</strong><br />
conditions for the development <strong>of</strong> the real estate<br />
market, and engagement <strong>in</strong> adm<strong>in</strong>istrative<br />
jurisdiction <strong>in</strong> the field <strong>of</strong> spatial, <strong>hous<strong>in</strong>g</strong> and real<br />
estate economy.<br />
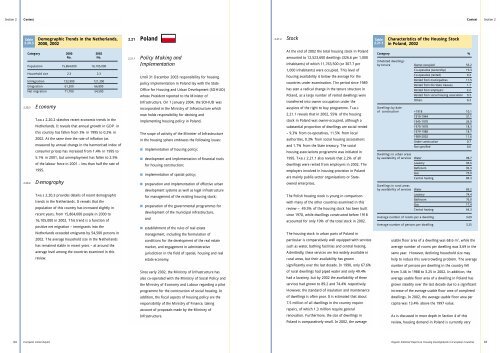
At the end <strong>of</strong> 2002 the total <strong>hous<strong>in</strong>g</strong> stock <strong>in</strong> Poland<br />
amounted to 12,523,600 dwell<strong>in</strong>gs (326.6 per 1,000<br />
<strong>in</strong>habitants) <strong>of</strong> which 11,763,500 (or 307.7 per<br />
1,000 <strong>in</strong>habitants) were occupied. This level <strong>of</strong><br />
<strong>hous<strong>in</strong>g</strong> availability is below the average for the<br />
<strong>countries</strong> under exam<strong>in</strong>ation. The period s<strong>in</strong>ce 1989<br />
has seen a radical change <strong>in</strong> the tenure structure <strong>in</strong><br />
Poland, as a large number <strong>of</strong> rented dwell<strong>in</strong>gs were<br />
transferred <strong>in</strong>to owner occupation under the<br />
auspices <strong>of</strong> the right to buy programme. TABLE<br />
2.21.1 reveals that <strong>in</strong> 2002, 55% <strong>of</strong> the <strong>hous<strong>in</strong>g</strong><br />
stock <strong>in</strong> Poland was owner-occupied, although a<br />
substantial proportion <strong>of</strong> dwell<strong>in</strong>gs are social rented<br />
– 9.3% from co-operatives, 11.5% from local<br />
authorities, 0.3% from social <strong>hous<strong>in</strong>g</strong> associations<br />
and 1.7% from the State treasury. The social<br />
<strong>hous<strong>in</strong>g</strong> associations programme was <strong>in</strong>itiated <strong>in</strong><br />
1995. TABLE 2.21.1 also reveals that 2.2% <strong>of</strong> all<br />
dwell<strong>in</strong>gs were rented from employers <strong>in</strong> 2002. The<br />
employers <strong>in</strong>volved <strong>in</strong> <strong>hous<strong>in</strong>g</strong> provision <strong>in</strong> Poland<br />
are ma<strong>in</strong>ly public-sector organisations or Stateowned<br />
enterprises.<br />
The Polish <strong>hous<strong>in</strong>g</strong> stock is young <strong>in</strong> comparison<br />
with many <strong>of</strong> the other <strong>countries</strong> exam<strong>in</strong>ed <strong>in</strong> this<br />
review – 49.3% <strong>of</strong> the <strong>hous<strong>in</strong>g</strong> stock has been built<br />
s<strong>in</strong>ce 1970, while dwell<strong>in</strong>gs constructed before 1918<br />
accounted for only 10% <strong>of</strong> the total stock <strong>in</strong> 2002.<br />
The <strong>hous<strong>in</strong>g</strong> stock <strong>in</strong> urban parts <strong>of</strong> Poland <strong>in</strong><br />
particular is comparatively well equipped with services<br />
such as water, bath<strong>in</strong>g facilities and central heat<strong>in</strong>g.<br />
Admittedly, these services are less widely available <strong>in</strong><br />
rural areas, but their availability has grown<br />
significantly over the last decade. In 1990, only 67.6%<br />
Category %<br />
Inhabited dwell<strong>in</strong>gs<br />
by tenure Owner-occupied 55.2<br />
Co-operative (ownership) 19.3<br />
Co-operative (rented) 9.3<br />
Rented from municipalities 11.5<br />
Rented from the State treasury 1.7<br />
Rented from employers 2.2<br />
Rented from social <strong>hous<strong>in</strong>g</strong> association 0.3<br />
Others 0.3<br />
Dwell<strong>in</strong>gs by date<br />
<strong>of</strong> construction