housing developments in european countries - Department of ...
housing developments in european countries - Department of ...
housing developments in european countries - Department of ...

You also want an ePaper? Increase the reach of your titles
YUMPU automatically turns print PDFs into web optimized ePapers that Google loves.
Section 2<br />
Context<br />
Context Section 2<br />
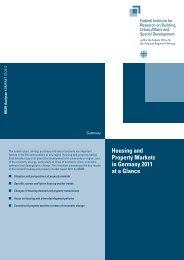
Table<br />
2.7.1<br />
Characteristics <strong>of</strong> the Hous<strong>in</strong>g Stock <strong>in</strong> Denmark, 1990-2003<br />
2.7.3 Economy<br />
2.8 Estonia<br />
Category 1990 1995 2000 2003<br />
Dwell<strong>in</strong>gs by tenure (%) Owner-occupied 51.7 50.4 51.4 50.6<br />
Rental dwell<strong>in</strong>gs total 42.2 44.3 44.8 45.0<br />
Of which are: – private 18.4 18.7 18.0 17.8<br />
– Non-pr<strong>of</strong>it <strong>hous<strong>in</strong>g</strong> 16.8 18.3 19.1 19.2<br />
– Co-operative dwell<strong>in</strong>gs 4.5 5.1 6.3 6.6<br />
– Government <strong>hous<strong>in</strong>g</strong> 2.6 2.2 1.4 1.4<br />
– Not occupied 6.1 5.3 3.8 4.4<br />
Dwell<strong>in</strong>gs by standard and<br />
availability <strong>of</strong> utilities (No.) Dwell<strong>in</strong>gs <strong>of</strong> satisfactory standard 2,027,000 2,170,000 2,291,000 2,370,000<br />
– <strong>of</strong> which were built before 1950 763,000 822,000 870,000 895,000<br />
Dwell<strong>in</strong>gs without bath<strong>in</strong>g facilities,<br />
a lavatory and heat<strong>in</strong>g 326,000 256,000 198,000 171,000<br />
– <strong>of</strong> which were built before 1950 288,000 250,000 173,000 141,000<br />
Dwell<strong>in</strong>g with no bath 271,000 218,000 169,000 145,000<br />
Dwell<strong>in</strong>g with no heat<strong>in</strong>g 128,000 86,000 46,000 36,000<br />
Dwell<strong>in</strong>g with no lavatory 85,000 70,000 55,000 48,000<br />
Total dwell<strong>in</strong>gs (No.) 2,353,000 2,427,000 2,489,000 2,541,000<br />
The standard <strong>of</strong> the Danish <strong>hous<strong>in</strong>g</strong> stock compares<br />
very well with the other <strong>countries</strong> exam<strong>in</strong>ed <strong>in</strong> this<br />
review. Table 2.7.1 reveals that <strong>in</strong> 2003, 93.3% <strong>of</strong> all<br />
dwell<strong>in</strong>gs were <strong>of</strong> satisfactory standard. Only 6.7% <strong>of</strong><br />
dwell<strong>in</strong>gs lacked basic amenities (i.e. a bath, toilet and<br />
Accurate data on levels <strong>of</strong> vacant dwell<strong>in</strong>gs <strong>in</strong> all<br />
tenures are not available. However, vacancy levels <strong>in</strong><br />
the rented <strong>hous<strong>in</strong>g</strong> stock are estimated to be<br />
considerably less than the level <strong>of</strong> 4.4% reported <strong>in</strong><br />
TABLE 2.7.1.<br />
heat<strong>in</strong>g) and 1.4% lacked<br />
heat<strong>in</strong>g (i.e. district or Table<br />
central heat<strong>in</strong>g or<br />
2.7.2 Economic Trends <strong>in</strong> Denmark, 2002-2005<br />
electrical heat<strong>in</strong>g <strong>in</strong> the Category 2002 2003 2004 2005<br />
case <strong>of</strong> s<strong>in</strong>gle-family<br />
houses). Danish dwell<strong>in</strong>gs<br />
(projected) (projected)<br />
% change (1995 prices)<br />
are also generously sized,<br />
especially <strong>in</strong> comparison<br />
with many Central and<br />
Eastern European<br />
<strong>countries</strong>. In 2003 the<br />
average floor space <strong>of</strong> a<br />
dwell<strong>in</strong>g <strong>in</strong> Denmark was<br />
GDP<br />
Private consumption<br />
Government consumption<br />
Residential construction<br />
Exports <strong>of</strong> goods and services<br />
Imports <strong>of</strong> goods and services<br />
Percentage change <strong>in</strong> total employment<br />
2.1<br />
1.9<br />
2.1<br />
6.6<br />
5.8<br />
4.2<br />
-0.4<br />
0.4<br />
1.2<br />
0.1<br />
8.5<br />
-0.4<br />
0.6<br />
-1.3<br />
2.1<br />
3.0<br />
0.7<br />
2.5<br />
3.9<br />
3.8<br />
0.3<br />
2.3<br />
2.5<br />
0.5<br />
-0.5<br />
4.6<br />
4.1<br />
0.7<br />
109.3 m 2 Percentage unemployment rate<br />
and <strong>in</strong> 2002,<br />
(us<strong>in</strong>g the EU def<strong>in</strong>ition) 4.5 5.5 5.6 5.1<br />
the average number <strong>of</strong><br />
rooms per dwell<strong>in</strong>g was<br />
3.69.<br />
Consumer price <strong>in</strong>dex 2.4 2.1 1.8 1.7<br />
Economic growth rates <strong>in</strong> Denmark are currently<br />
modest. GDP (measured at constant 1995 prices)<br />
<strong>in</strong>creased by 0.4% <strong>in</strong> 2003, but is expected to rise by<br />
over 2% <strong>in</strong> 2004 and 2005 due to an active fiscal<br />
policy, low <strong>in</strong>terest rates, <strong>in</strong>ternational recovery and<br />
domestic consumption.<br />
At the same time unemployment and <strong>in</strong>flation <strong>in</strong> the<br />
country rema<strong>in</strong> at low levels. The unemployment rate<br />
was 5.5% <strong>in</strong> 2003, while <strong>in</strong>flation (as measured by the<br />
consumer price <strong>in</strong>dex) has fallen from 2.4% <strong>in</strong> 2002 to<br />
2.1% <strong>in</strong> 2003, and is projected to fall further by 2005.<br />
2.7.4 Demography<br />
Table<br />
2.7.3<br />
The population <strong>of</strong> Denmark was 5,368,354 persons <strong>in</strong><br />
2002 – an <strong>in</strong>crease <strong>of</strong> 38,334 persons s<strong>in</strong>ce 2000.<br />
TABLE 2.7.3 reveals that this <strong>in</strong>crease is related to both<br />
natural <strong>in</strong>crease and positive net migration, although<br />
<strong>of</strong> the two the former is the more significant factor.<br />
There were 2,466,693 households <strong>in</strong> Denmark <strong>in</strong><br />
2003, and average household size was 2.2 persons per<br />
household, which is one <strong>of</strong> the lowest among the<br />
various <strong>countries</strong> <strong>in</strong>cluded <strong>in</strong> this review.<br />
Demographic Trends <strong>in</strong> Denmark, 2000-2002<br />
Population Net migration Total<br />
at Live net<br />
1 January births Deaths Immigration Emigration <strong>in</strong>crease<br />
Year No. No. No. No. No. No.<br />
2000 5,330,020 67,081 57,986 52,915 43,417 18,593<br />
2001 5,349,212 65,450 58,338 55,984 43,980 19,116<br />
2002 5,368,354 64,149 58,610 52,778 43,481 14,836<br />
2.8.1 Policy Mak<strong>in</strong>g and<br />
Implementation<br />
The key objectives <strong>of</strong> <strong>hous<strong>in</strong>g</strong> policy <strong>in</strong> Estonia are set<br />
out <strong>in</strong> the Estonian <strong>hous<strong>in</strong>g</strong> development plan for the<br />
years 2003-2008, which <strong>in</strong> turn takes account <strong>of</strong> the<br />
Estonian Hous<strong>in</strong>g Development Plan Until 2010<br />
which was produced by a commission <strong>of</strong> <strong>hous<strong>in</strong>g</strong><br />
experts established by the Estonian government <strong>in</strong><br />
1998.<br />
Accord<strong>in</strong>g to these documents the general purpose <strong>of</strong><br />
State activity <strong>in</strong> the <strong>hous<strong>in</strong>g</strong> sector is to provide all<br />
Estonia’s residents with an option to choose their place<br />
<strong>of</strong> dwell<strong>in</strong>g. The ma<strong>in</strong> task is to create conditions <strong>in</strong><br />
the <strong>hous<strong>in</strong>g</strong> market (legal regulation, <strong>in</strong>stitutional<br />
regulation and support measures) that would allow<br />
owners, tenants and citizen-<strong>in</strong>itiated <strong>hous<strong>in</strong>g</strong><br />
organisations to solve their problems <strong>in</strong>dependently<br />
and to carry out <strong>in</strong>dividual <strong>hous<strong>in</strong>g</strong> strategies. The<br />
State’s <strong>hous<strong>in</strong>g</strong> development activities are based on the<br />
pr<strong>in</strong>ciples <strong>of</strong> balanced social and regional development.<br />
On the basis <strong>of</strong> these key objectives, the present<br />
development plan sets forth specific goals for the<br />
central government’s <strong>hous<strong>in</strong>g</strong> activities<br />
between 2003 and 2008. These <strong>in</strong>clude:<br />
■<br />
■<br />
■<br />
ensur<strong>in</strong>g the preservation <strong>of</strong><br />
exist<strong>in</strong>g <strong>hous<strong>in</strong>g</strong> stock;<br />
improv<strong>in</strong>g the flexibility <strong>of</strong><br />
regional <strong>hous<strong>in</strong>g</strong> markets;<br />
improv<strong>in</strong>g <strong>hous<strong>in</strong>g</strong>-related<br />
f<strong>in</strong>ance opportunities;<br />
■ prolong<strong>in</strong>g the life span <strong>of</strong> exist<strong>in</strong>g <strong>hous<strong>in</strong>g</strong> stock,<br />
especially prevent<strong>in</strong>g large apartment build<strong>in</strong>gs<br />
from becom<strong>in</strong>g un<strong>in</strong>habitable due to <strong>in</strong>sufficient<br />
ma<strong>in</strong>tenance and repairs, and<br />
■ address<strong>in</strong>g the problems <strong>of</strong> tenants liv<strong>in</strong>g <strong>in</strong><br />
dwell<strong>in</strong>gs which have been returned to their orig<strong>in</strong>al<br />
owners by the State.<br />
32 European Union Report<br />
Regular National Report on Hous<strong>in</strong>g Developments <strong>in</strong> European Countries<br />
33