housing developments in european countries - Department of ...
housing developments in european countries - Department of ...
housing developments in european countries - Department of ...

You also want an ePaper? Increase the reach of your titles
YUMPU automatically turns print PDFs into web optimized ePapers that Google loves.
Section 2<br />
Context<br />
Context Section 2<br />
2.13 Hungary<br />
Table<br />
2.13.1<br />
Characteristics <strong>of</strong> the Hous<strong>in</strong>g Stock<br />
<strong>in</strong> Hungary, 1996<br />
Table<br />
2.13.2<br />
Economic Trends <strong>in</strong> Hungary, 1995-2001<br />
2.13.1 Policy Mak<strong>in</strong>g and<br />
Implementation<br />
Like many <strong>of</strong> the other Central and Eastern European<br />
<strong>countries</strong> that jo<strong>in</strong>ed the EU <strong>in</strong> 2004, the <strong>hous<strong>in</strong>g</strong><br />
system and <strong>hous<strong>in</strong>g</strong> policy <strong>in</strong> Hungary has seen rapid<br />
change over the last decade. Before the early 1990s<br />
State fund<strong>in</strong>g played a major role <strong>in</strong> driv<strong>in</strong>g new<br />
<strong>hous<strong>in</strong>g</strong> output. However, the period s<strong>in</strong>ce then has<br />
seen a range <strong>of</strong> radical changes to <strong>hous<strong>in</strong>g</strong> policy:<br />
■ central government fund<strong>in</strong>g for <strong>hous<strong>in</strong>g</strong> has been<br />
cut significantly;<br />
■ local government <strong>in</strong>volvement <strong>in</strong> the construction <strong>of</strong><br />
new social rented <strong>hous<strong>in</strong>g</strong> has decl<strong>in</strong>ed significantly,<br />
and<br />
■ the majority <strong>of</strong> the <strong>hous<strong>in</strong>g</strong> stock is now owneroccupied<br />
as a result <strong>of</strong> the privatisation <strong>of</strong> dwell<strong>in</strong>gs<br />
that were formerly rented from local authorities.<br />
S<strong>in</strong>ce the end <strong>of</strong> the 1990s central government has<br />
<strong>in</strong>itiated a number <strong>of</strong> important new <strong>in</strong>itiatives<br />
relevant to <strong>hous<strong>in</strong>g</strong> policy. The State support for rented<br />
<strong>hous<strong>in</strong>g</strong> programme was <strong>in</strong>itiated <strong>in</strong> 2002. This<br />
programme provides subsidies to local authorities <strong>in</strong><br />
order to <strong>in</strong>crease the supply <strong>of</strong> rented <strong>hous<strong>in</strong>g</strong>. To date,<br />
11,165 dwell<strong>in</strong>gs have been constructed under the<br />
auspices <strong>of</strong> the scheme, most <strong>of</strong> which are small <strong>in</strong> size<br />
with 1 or 2 rooms. 75% <strong>of</strong> the subsidies available<br />
under the scheme have been devoted to social <strong>hous<strong>in</strong>g</strong>.<br />
In 2001 a programme to refurbish system-built<br />
<strong>hous<strong>in</strong>g</strong> was <strong>in</strong>itiated. To date, most <strong>of</strong> the works<br />
carried out under this scheme have <strong>in</strong>volved <strong>in</strong>sulation.<br />
In addition, a separate programme to fund <strong>hous<strong>in</strong>g</strong><br />
refurbishment <strong>in</strong> the large cities has been established.<br />
2.13.2 Stock<br />
In 2000 the number <strong>of</strong> dwell<strong>in</strong>gs <strong>in</strong> Hungary totalled<br />
4,076,800, while the number <strong>of</strong> dwell<strong>in</strong>gs per 1,000<br />
<strong>in</strong>habitants stood at 406.7. The latter figure is just<br />
below the average for the 28 <strong>countries</strong> under<br />
Category %<br />
Households by number<br />
<strong>of</strong> rooms 1 room 1.8<br />
2 rooms 15.3<br />
3 rooms 41.2<br />
4 rooms 29.5<br />
5 rooms 8.2<br />
6 or more rooms 4.0<br />
Dwell<strong>in</strong>gs by tenure Owner-occupied 86.9<br />
Rented 10.4<br />
Dwell<strong>in</strong>gs by period<br />
<strong>of</strong> construction < 1919 15.6<br />
1919-1940 13.9<br />
1941-1960 12.1<br />
1961-1970 15.1<br />
1971-1980 21.4<br />
1981-1990 17.5<br />
> 1991 4.0<br />
Dwell<strong>in</strong>gs by availability<br />
<strong>of</strong> amenities Piped water 84.4<br />
Fixed bath or shower 79.6<br />
Lavatory 75.6<br />
Central heat<strong>in</strong>g 48.2<br />
exam<strong>in</strong>ation but considerably higher than the average<br />
among the CEE <strong>countries</strong> which acceded to EU<br />
membership <strong>in</strong> 2004. Indeed, the number <strong>of</strong> dwell<strong>in</strong>gs<br />
<strong>in</strong> Hungary is currently some 130,000 more than the<br />
number <strong>of</strong> households. At the same time there is a<br />
shortage <strong>of</strong> dwell<strong>in</strong>gs <strong>in</strong> parts <strong>of</strong> the country where<br />
economic growth is greatest, and due to high vacancy<br />
rates, there is also a problem <strong>of</strong> <strong>in</strong>adequate<br />
ma<strong>in</strong>tenance and poor <strong>hous<strong>in</strong>g</strong> standards.<br />
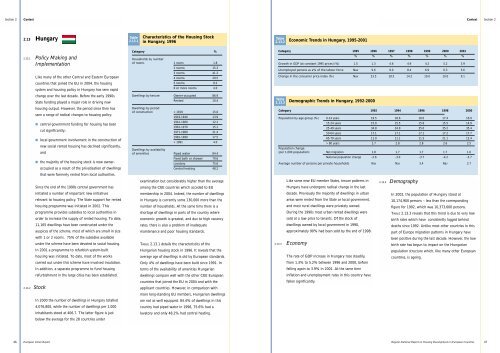
TABLE 2.13.1 details the characteristics <strong>of</strong> the<br />
Hungarian <strong>hous<strong>in</strong>g</strong> stock <strong>in</strong> 1996. It reveals that the<br />
average age <strong>of</strong> dwell<strong>in</strong>gs is old by European standards.<br />
Only 4% <strong>of</strong> dwell<strong>in</strong>gs have been built s<strong>in</strong>ce 1991. In<br />
terms <strong>of</strong> the availability <strong>of</strong> amenities Hungarian<br />
dwell<strong>in</strong>gs compare well with the other CEE European<br />
<strong>countries</strong> that jo<strong>in</strong>ed the EU <strong>in</strong> 2004 and with the<br />
applicant <strong>countries</strong>. However, <strong>in</strong> comparison with<br />
more long-stand<strong>in</strong>g EU members, Hungarian dwell<strong>in</strong>gs<br />
are not as well equipped. 84.4% <strong>of</strong> dwell<strong>in</strong>gs <strong>in</strong> this<br />
country had piped water <strong>in</strong> 1996, 75.6% had a<br />
lavatory and only 48.2% had central heat<strong>in</strong>g.<br />
Category 1995 1996 1997 1998 1999 2000 2001<br />
% % % % % % %<br />
Growth <strong>in</strong> GDP (at constant 1995 prices) (%) 1.5 1.3 4.6 4.9 4.2 5.2 3.9<br />
Unemployed persons as a% <strong>of</strong> the labour force Nav 9.6 9.0 8.4 6.9 6.3 5.6<br />
Change <strong>in</strong> the consumer price <strong>in</strong>dex (%) Nav 23.5 18.5 14.2 10.0 10.0 9.1<br />
Table<br />
2.13.3<br />
Demographic Trends <strong>in</strong> Hungary, 1992-2000<br />
Category 1992 1994 1996 1998 2000<br />
Population by age group (%) 0-14 years 19.5 18.6 18.0 17.4 16.9<br />
15-24 years 15.0 15.5 15.6 15.5 14.9<br />
25-49 years 34.8 34.9 35.0 35.2 35.4<br />
50-64 years 17.1 17.1 17.1 17.2 17.7<br />
65-79 years 11.0 11.1 11.5 21.1 12.4<br />
> 80 years 2.7 2.8 2.8 2.6 2.5<br />
Population change<br />
(per 1,000 population) Net migration 1.8 1.7 1.7 1.7 1.6<br />
National population change –2.6 –3.0 –3.7 –4.2 –3.7<br />
Average number <strong>of</strong> persons per private households Nav Nav 3.4 Nav 2.7<br />
Like some new EU member States, tenure patterns <strong>in</strong><br />
Hungary have undergone radical change <strong>in</strong> the last<br />
decade. Previously the majority <strong>of</strong> dwell<strong>in</strong>gs <strong>in</strong> urban<br />
areas were rented from the State or local government,<br />
and most rural dwell<strong>in</strong>gs were privately owned.<br />
Dur<strong>in</strong>g the 1990s most urban rented dwell<strong>in</strong>gs were<br />
sold at a low price to tenants. Of the stock <strong>of</strong><br />
dwell<strong>in</strong>gs owned by local government <strong>in</strong> 1990,<br />
approximately 90% had been sold by the end <strong>of</strong> 1998.<br />
2.13.3 Economy<br />
The rate <strong>of</strong> GDP <strong>in</strong>crease <strong>in</strong> Hungary rose steadily,<br />
from 1.3% to 5.2% between 1996 and 2000, before<br />
fall<strong>in</strong>g aga<strong>in</strong> to 3.9% <strong>in</strong> 2001. At the same time<br />
<strong>in</strong>flation and unemployment rates <strong>in</strong> this country have<br />
fallen significantly.<br />
2.13.4 Demography<br />
In 2002, the population <strong>of</strong> Hungary stood at<br />
10,174,900 persons – less than the correspond<strong>in</strong>g<br />
figure for 1992, which was 10,373,600 persons.<br />
TABLE 2.13.3 reveals that this trend is due to very low<br />
birth rates which have consistently lagged beh<strong>in</strong>d<br />
deaths s<strong>in</strong>ce 1992. Unlike most other <strong>countries</strong> <strong>in</strong> this<br />
part <strong>of</strong> Europe migration patterns <strong>in</strong> Hungary have<br />
been positive dur<strong>in</strong>g the last decade. However, the low<br />
birth rate has begun to impact on the Hungarian<br />
population structure which, like many other European<br />
<strong>countries</strong>, is age<strong>in</strong>g.<br />
46 European Union Report<br />
Regular National Report on Hous<strong>in</strong>g Developments <strong>in</strong> European Countries<br />
47