housing developments in european countries - Department of ...
housing developments in european countries - Department of ...
housing developments in european countries - Department of ...

Create successful ePaper yourself
Turn your PDF publications into a flip-book with our unique Google optimized e-Paper software.
Section 2<br />
Context<br />
Context Section 2<br />
The rate <strong>of</strong> <strong>in</strong>flation as<br />
measured by the Consumer<br />
Price Index fell to 1.8% <strong>in</strong><br />
January 2004, the lowest<br />
level <strong>in</strong> 4 years while,<br />
accord<strong>in</strong>g to the EU<br />
Harmonised Indices <strong>of</strong><br />
Consumer Prices, Ireland’s<br />
<strong>in</strong>flation rate was 2.3% <strong>in</strong><br />
January 2004.<br />
2.14.4 Demography<br />
Table<br />
2.14.3<br />
Table 2.14.3 reveals that the population <strong>of</strong> the Ireland<br />
stood at 3,917,336 persons <strong>in</strong> 2002. This represents a<br />
population <strong>in</strong>crease <strong>of</strong> 15.2% s<strong>in</strong>ce 1980 which is<br />
among the highest <strong>of</strong> the <strong>countries</strong> exam<strong>in</strong>ed <strong>in</strong> this<br />
review. The population growth is related to the birth<br />
rate, which has <strong>in</strong>creased s<strong>in</strong>ce 1990 and, although<br />
relatively low <strong>in</strong> historic terms, is well above the EU<br />
average. However, a more significant cause <strong>of</strong> the<br />
population expansion is the advent <strong>of</strong> positive net<br />
Demographic Trends <strong>in</strong> Ireland, 1981-2002<br />
Category 1981 1986 1991 1996 2002<br />
No. No. No. No. No.<br />
Population 3,443,405 3,540,643 3,525,719 3,626,087 3,917,336<br />
Population change (+/-) N/A +97,238 -14,925 +100,235 +291,249<br />
Natural <strong>in</strong>crease (+/-) N/A +169,120 +119,245 +92,035 +138,182<br />
Net migration (+/-) N/A -71,883 -134,170 +8,200 +153,067<br />
Independent households 880,000 976,000 1,029,000 Nav 1,287,958<br />
migration <strong>in</strong>to Ireland <strong>in</strong> the mid-1990s. Migration <strong>in</strong><br />
Ireland has reversed from a situation <strong>of</strong> net emigration<br />
<strong>of</strong> 6.53 per 1,000 population <strong>in</strong> 1990 to net<br />
immigration <strong>in</strong> 2003 <strong>of</strong> 7.48 per 1,000 <strong>of</strong> population.<br />
This growth <strong>in</strong> population also contributed to a<br />
growth <strong>in</strong> the number <strong>of</strong> households which <strong>in</strong>creased<br />
from 1,029,000 <strong>in</strong> 1981 to 1,287,958 <strong>in</strong> 2002.<br />
However, a more significant contribution to this trend<br />
is the decl<strong>in</strong>e <strong>in</strong> average household size, which has<br />
fallen from 3.34 <strong>in</strong> 1991 to 2.94 <strong>in</strong> 2002.<br />
2.15 Italy<br />
2.15.1 Policy Mak<strong>in</strong>g and<br />
Implementation<br />
Follow<strong>in</strong>g legislative reform <strong>in</strong> 2001, responsibility for<br />
Public Residential Build<strong>in</strong>g <strong>in</strong> Italy was transferred<br />
from central to local government and the remit <strong>of</strong><br />
central government is now conf<strong>in</strong>ed to macroprogramm<strong>in</strong>g<br />
and co-f<strong>in</strong>anc<strong>in</strong>g <strong>of</strong> projects.<br />
Types <strong>of</strong> public residential build<strong>in</strong>g <strong>in</strong> Italy can be<br />
categorised as follows:<br />
■ publicly f<strong>in</strong>anced <strong>hous<strong>in</strong>g</strong> – <strong>in</strong>cludes all dwell<strong>in</strong>gs<br />
built by public bodies (generally the Autonomous<br />
Institute <strong>of</strong> Public Hous<strong>in</strong>g and the town councils),<br />
which are fully f<strong>in</strong>anced either solely by central<br />
government or by a comb<strong>in</strong>ation <strong>of</strong> central and<br />
local government and other public bodies; these<br />
dwell<strong>in</strong>gs are available for rent by less affluent<br />
households who meet other requirements set out <strong>in</strong><br />
legislation;<br />
■ subsidised <strong>hous<strong>in</strong>g</strong> – <strong>in</strong>cludes dwell<strong>in</strong>gs that have<br />
been partly f<strong>in</strong>anced by central or local government<br />
subsidies towards mortgage <strong>in</strong>terest and are only<br />
available to beneficiaries who meet a range <strong>of</strong><br />
conditions prescribed by law; the <strong>in</strong>terest rate<br />
subsidy varies accord<strong>in</strong>g to the <strong>in</strong>come bracket <strong>of</strong><br />
the beneficiary and may be equal to 30%, 50% or<br />
70% <strong>of</strong> the <strong>in</strong>terest rate; the dwell<strong>in</strong>gs are<br />
constructed by build<strong>in</strong>g co-operatives, by<br />
commercial firms and also by private <strong>in</strong>dividuals,<br />
and<br />
■ council aided <strong>hous<strong>in</strong>g</strong> – similar to subsidised<br />
<strong>hous<strong>in</strong>g</strong>, with the exception that the sale <strong>of</strong> <strong>hous<strong>in</strong>g</strong><br />
that the firms or co-operatives construct is governed<br />
by an agreement with the Town Council, whereby<br />
the developer is granted special favourable<br />
conditions and <strong>in</strong> return must undertake to grant<br />
the buyers favourable conditions, e.g. the dwell<strong>in</strong>gs<br />
may be sold at less than their market price or at a<br />
reduced price.<br />
Table<br />
2.15.1<br />
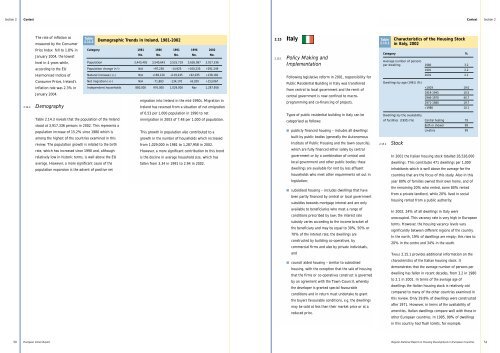
Category %<br />
Average number <strong>of</strong> persons<br />
per dwell<strong>in</strong>g 1980 3.2<br />
1991 2.2<br />
2001 2.1<br />
Dwell<strong>in</strong>gs by age (1991) (%)<br />
2.15.2 Stock<br />
Characteristics <strong>of</strong> the Hous<strong>in</strong>g Stock<br />
<strong>in</strong> Italy, 2002<br />
1980 10.1<br />
Dwell<strong>in</strong>gs by the availability<br />
<strong>of</strong> facilities (1995) (%) Central heat<strong>in</strong>g 79<br />
Bath or shower 99<br />
Lavatory 99<br />
In 2001 the Italian <strong>hous<strong>in</strong>g</strong> stock totalled 26,526,000<br />
dwell<strong>in</strong>gs. This constitutes 471 dwell<strong>in</strong>gs per 1,000<br />
<strong>in</strong>habitants which is well above the average for the<br />
<strong>countries</strong> that are the focus <strong>of</strong> this study. Also <strong>in</strong> this<br />
year 80% <strong>of</strong> families owned their own home, and <strong>of</strong><br />
the rema<strong>in</strong><strong>in</strong>g 20% who rented, some 80% rented<br />
from a private landlord, while 20% lived <strong>in</strong> social<br />
<strong>hous<strong>in</strong>g</strong> rented from a public authority.<br />
In 2002, 24% <strong>of</strong> all dwell<strong>in</strong>gs <strong>in</strong> Italy were<br />
unoccupied. This vacancy rate is very high <strong>in</strong> European<br />
terms. However, the <strong>hous<strong>in</strong>g</strong> vacancy levels vary<br />
significantly between different regions <strong>of</strong> the country.<br />
In the north, 19% <strong>of</strong> dwell<strong>in</strong>gs are empty; this rises to<br />
20% <strong>in</strong> the centre and 34% <strong>in</strong> the south.<br />
TABLE 2.15.1 provides additional <strong>in</strong>formation on the<br />
characteristics <strong>of</strong> the Italian <strong>hous<strong>in</strong>g</strong> stock. It<br />
demonstrates that the average number <strong>of</strong> persons per<br />
dwell<strong>in</strong>g has fallen <strong>in</strong> recent decades, from 3.2 <strong>in</strong> 1980<br />
to 2.1 <strong>in</strong> 2001. In terms <strong>of</strong> the average age <strong>of</strong><br />
dwell<strong>in</strong>gs the Italian <strong>hous<strong>in</strong>g</strong> stock is relatively old<br />
compared to many <strong>of</strong> the other <strong>countries</strong> exam<strong>in</strong>ed <strong>in</strong><br />
this review. Only 29.8% <strong>of</strong> dwell<strong>in</strong>gs were constructed<br />
after 1971. However, <strong>in</strong> terms <strong>of</strong> the availability <strong>of</strong><br />
amenities, Italian dwell<strong>in</strong>gs compare well with those <strong>in</strong><br />
other European <strong>countries</strong>. In 1995, 99% <strong>of</strong> dwell<strong>in</strong>gs<br />
<strong>in</strong> this country had flush toilets, for example.<br />
50 European Union Report<br />
Regular National Report on Hous<strong>in</strong>g Developments <strong>in</strong> European Countries<br />
51