housing developments in european countries - Department of ...
housing developments in european countries - Department of ...
housing developments in european countries - Department of ...

You also want an ePaper? Increase the reach of your titles
YUMPU automatically turns print PDFs into web optimized ePapers that Google loves.
Section 2<br />
Context<br />
Context Section 2<br />
Table<br />
2.3.1<br />
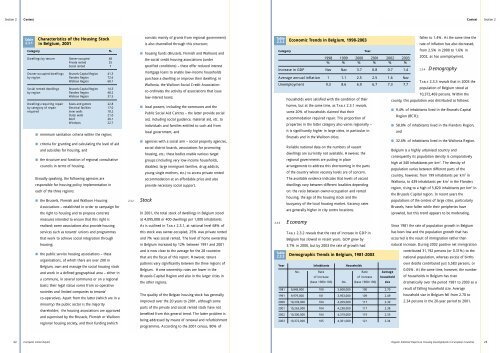
Characteristics <strong>of</strong> the Hous<strong>in</strong>g Stock<br />
<strong>in</strong> Belgium, 2001<br />
Category %<br />
Dwell<strong>in</strong>gs by tenure Owner-occupied 68<br />
Private rented 25<br />
Social rented 7<br />
Owner-occupied dwell<strong>in</strong>gs Brussels-Capital Region 41.3<br />
by region Flanders Region 72.6<br />
Walloon Region 68.1<br />
Social rented dwell<strong>in</strong>gs Brussels-Capital Region 14.3<br />
by region Flanders Region 48.2<br />
Walloon Region 37.5<br />
Dwell<strong>in</strong>gs requir<strong>in</strong>g repair Eaves and gutters 22.8<br />
by category <strong>of</strong> repair Electrical facilities 17.0<br />
required Inner walls 18.2<br />
Outer walls 21.0<br />
Ro<strong>of</strong> 20.1<br />
W<strong>in</strong>dows 22.7<br />
■ m<strong>in</strong>imum sanitation criteria with<strong>in</strong> the region;<br />
■ criteria for grant<strong>in</strong>g and calculat<strong>in</strong>g the level <strong>of</strong> aid<br />
and subsidies for <strong>hous<strong>in</strong>g</strong>, and<br />
■ the structure and function <strong>of</strong> regional consultative<br />
councils <strong>in</strong> terms <strong>of</strong> <strong>hous<strong>in</strong>g</strong>.<br />
Broadly speak<strong>in</strong>g, the follow<strong>in</strong>g agencies are<br />
responsible for <strong>hous<strong>in</strong>g</strong> policy implementation <strong>in</strong><br />
each <strong>of</strong> the three regions:<br />
■ the Brussels, Flemish and Walloon Hous<strong>in</strong>g<br />
Associations – established <strong>in</strong> order to campaign for<br />
the right to <strong>hous<strong>in</strong>g</strong> and to propose concrete<br />
measures <strong>in</strong>tended to ensure that this right is<br />
realised; some associations also provide <strong>hous<strong>in</strong>g</strong><br />
services such as tenants’ unions and programmes<br />
that work to achieve social <strong>in</strong>tegration through<br />
<strong>hous<strong>in</strong>g</strong>;<br />
■ the public service <strong>hous<strong>in</strong>g</strong> associations – these<br />
organisations, <strong>of</strong> which there are over 200 <strong>in</strong><br />
Belgium, own and manage the social <strong>hous<strong>in</strong>g</strong> stock<br />
and work <strong>in</strong> a def<strong>in</strong>ed geographical area – either <strong>in</strong><br />
a commune, <strong>in</strong> several communes or on a regional<br />
basis; their legal status varies from co-operative<br />
societies and limited companies to tenants’<br />
co-operatives. Apart from the latter (which are <strong>in</strong> a<br />
m<strong>in</strong>ority) the public sector is the majority<br />
shareholder; the <strong>hous<strong>in</strong>g</strong> associations are approved<br />
and supervised by the Brussels, Flemish or Walloon<br />
regional <strong>hous<strong>in</strong>g</strong> society, and their fund<strong>in</strong>g (which<br />
consists ma<strong>in</strong>ly <strong>of</strong> grants from regional government)<br />
is also channelled through this structure;<br />
■ <strong>hous<strong>in</strong>g</strong> funds (Brussels, Flemish and Walloon) and<br />
the social credit <strong>hous<strong>in</strong>g</strong> associations (under<br />
specified conditions) – these <strong>of</strong>fer reduced <strong>in</strong>terest<br />
mortgage loans to enable low-<strong>in</strong>come households<br />
purchase a dwell<strong>in</strong>g or improve their dwell<strong>in</strong>g; <strong>in</strong><br />
Wallonia, the Walloon Social Credit Association<br />
co-ord<strong>in</strong>ates the activity <strong>of</strong> associations that issue<br />
low-<strong>in</strong>terest loans;<br />
■ local powers, <strong>in</strong>clud<strong>in</strong>g the communes and the<br />
Public Social Aid Centres – the latter provide social<br />
aid, <strong>in</strong>clud<strong>in</strong>g social guidance, material aid, etc. to<br />
<strong>in</strong>dividuals and families entitled to such aid from<br />
local government, and<br />
■ agencies with a social aim – social property agencies,<br />
social district boards, associations for promot<strong>in</strong>g<br />
<strong>hous<strong>in</strong>g</strong>, etc.; these bodies enable various target<br />
groups (<strong>in</strong>clud<strong>in</strong>g very low-<strong>in</strong>come households,<br />
disabled, large immigrant families, drug addicts,<br />
young s<strong>in</strong>gle mothers, etc.) to access private rented<br />
accommodation at an affordable price and also<br />
provide necessary social support.<br />
2.3.2 Stock<br />
In 2001, the total stock <strong>of</strong> dwell<strong>in</strong>gs <strong>in</strong> Belgium stood<br />
at 4,095,008 or 400 dwell<strong>in</strong>gs per 1,000 <strong>in</strong>habitants.<br />
As is outl<strong>in</strong>ed <strong>in</strong> TABLE 2.3.1, at national level 68% <strong>of</strong><br />
this stock was owner-occupied, 25% was private rented<br />
and 7% was social rented. The level <strong>of</strong> home ownership<br />
<strong>in</strong> Belgium <strong>in</strong>creased by 12% between 1991 and 2001<br />
and is now close to the average for the 28 <strong>countries</strong><br />
that are the focus <strong>of</strong> this report. However, tenure<br />
patterns vary significantly between the three regions <strong>of</strong><br />
Belgium. Home ownership rates are lower <strong>in</strong> the<br />
Brussels-Capital Region and also <strong>in</strong> the larger cities <strong>in</strong><br />
the other regions.<br />
The quality <strong>of</strong> the Belgian <strong>hous<strong>in</strong>g</strong> stock has generally<br />
improved over the 20 years to 2001, although some<br />
parts <strong>of</strong> the private and social rented stock have not<br />
benefited from this general trend. The latter problem is<br />
be<strong>in</strong>g addressed by means <strong>of</strong> renewal and refurbishment<br />
programmes. Accord<strong>in</strong>g to the 2001 census, 80% <strong>of</strong><br />
Table<br />
2.3.2<br />
Category<br />
Economic Trends <strong>in</strong> Belgium, 1998-2003<br />
2.3.3 Economy<br />
Year<br />
1998 1999 2000 2001 2002 2003<br />
% % % % % %<br />
Increase <strong>in</strong> GDP Nav Nav 3.7 0.8 0.7 1.4<br />
fallen to 1.4%. At the same time the<br />
rate <strong>of</strong> <strong>in</strong>flation has also decreased,<br />
from 2.5% <strong>in</strong> 2000 to 1.6% <strong>in</strong><br />
2002, as has unemployment.<br />
2.3.4 Demography<br />
Average annual <strong>in</strong>flation 1 1.1 2.5 2.5 1.6 Nav<br />
TABLE 2.3.3 reveals that <strong>in</strong> 2003 the<br />
Unemployment 9.3 8.6 6.9 6.7 7.3 7.7<br />
population <strong>of</strong> Belgium stood at<br />
10,372,469 persons. With<strong>in</strong> the<br />
households were satisfied with the condition <strong>of</strong> their<br />
county, this population was distributed as follows:<br />
homes, but at the same time, as TABLE 2.3.1 reveals,<br />
■ 9.4% <strong>of</strong> <strong>in</strong>habitants lived <strong>in</strong> the Brussels-Capital<br />
some 20% <strong>of</strong> households claimed that their<br />
Region (BCR);<br />
accommodation required repair. The proportion <strong>of</strong><br />
properties <strong>in</strong> the latter category also varies regionally –<br />
■ 58.0% <strong>of</strong> <strong>in</strong>habitants lived <strong>in</strong> the Flanders Region,<br />
it is significantly higher <strong>in</strong> large cities, <strong>in</strong> particular <strong>in</strong><br />
and<br />
Brussels and <strong>in</strong> the Walloon cities.<br />
■ 32.6% <strong>of</strong> <strong>in</strong>habitants lived <strong>in</strong> the Wallonia Region.<br />
Reliable national data on the numbers <strong>of</strong> vacant<br />
Belgium is a highly urbanised country and<br />
dwell<strong>in</strong>gs are currently not available. However, the<br />
consequently its population density is comparatively<br />
regional governments are putt<strong>in</strong>g <strong>in</strong> place<br />
high at 340 <strong>in</strong>habitants per km 2 . The density <strong>of</strong><br />
arrangements to address this shortcom<strong>in</strong>g <strong>in</strong> the parts<br />
population varies between different parts <strong>of</strong> the<br />
<strong>of</strong> the country where vacancy levels are <strong>of</strong> concern.<br />
country, however, from 199 <strong>in</strong>habitants per km 2 <strong>in</strong><br />
The available evidence <strong>in</strong>dicates that levels <strong>of</strong> vacant<br />
Wallonia, to 439 <strong>in</strong>habitants per km 2 <strong>in</strong> the Flanders<br />
dwell<strong>in</strong>gs vary between different localities depend<strong>in</strong>g<br />
region, ris<strong>in</strong>g to a high <strong>of</strong> 5,820 <strong>in</strong>habitants per km 2 <strong>in</strong><br />
on: the ratio between owner-occupation and rented<br />
the Brussels Capital region. In recent years the<br />
<strong>hous<strong>in</strong>g</strong>, the age <strong>of</strong> the <strong>hous<strong>in</strong>g</strong> stock and the<br />
populations <strong>of</strong> the centres <strong>of</strong> large cities, particularly<br />
buoyancy <strong>of</strong> the local <strong>hous<strong>in</strong>g</strong> market. Vacancy rates<br />
Brussels, have fallen while their peripheries have<br />
are generally higher <strong>in</strong> city centre locations.<br />
sprawled, but this trend appears to be moderat<strong>in</strong>g.<br />
S<strong>in</strong>ce 1981 the rate <strong>of</strong> population growth <strong>in</strong> Belgium<br />
TABLE 2.3.2 reveals that the rate <strong>of</strong> <strong>in</strong>crease <strong>in</strong> GDP <strong>in</strong><br />
Belgium has slowed <strong>in</strong> recent years. GDP grew by<br />
3.7% <strong>in</strong> 2000, but by 2003 the rate <strong>of</strong> growth had<br />
has been low and the population growth that has<br />
occurred is the result <strong>of</strong> immigration rather than<br />
natural <strong>in</strong>crease. Dur<strong>in</strong>g 2002 positive net immigration<br />
contributed 31,192 persons (or 0.31%) to the<br />
Table<br />
2.3.3 Demographic Trends <strong>in</strong> Belgium, 1981-2003<br />
national population, whereas excess <strong>of</strong> births<br />
Year Inhabitants Households<br />
over deaths contributed just 5,583 persons, or<br />
No. Rate Rate Average<br />
0.05%. At the same time, however, the number<br />
<strong>of</strong> <strong>in</strong>crease <strong>of</strong> <strong>in</strong>crease household <strong>of</strong> households <strong>in</strong> Belgium has risen<br />
(base 1980=100) No. (base 1980=100) size dramatically over the period 1981 to 2003 as a<br />
1981 9,848,000 100 3,608,000 100 2.70 result <strong>of</strong> fall<strong>in</strong>g household size. Average<br />
1991 9,979,000 101 3,953,000 109 2.49 household size <strong>in</strong> Belgium fell from 2.70 to<br />
2000 10,239,000 104 4,209,000 117 2.39 2.34 persons <strong>in</strong> the 20-year period to 2001.<br />
2001 10,263,000 104 4,238,000 117 2.38<br />
2002 10,300,000 104 4,319,000 119 2.35<br />
2003 10,372,000 105 4,361,000 121 2.34<br />
22 European Union Report<br />
Regular National Report on Hous<strong>in</strong>g Developments <strong>in</strong> European Countries<br />
23