History Matters: Path dependence and innovation in British city ...
History Matters: Path dependence and innovation in British city ...
History Matters: Path dependence and innovation in British city ...

Create successful ePaper yourself
Turn your PDF publications into a flip-book with our unique Google optimized e-Paper software.
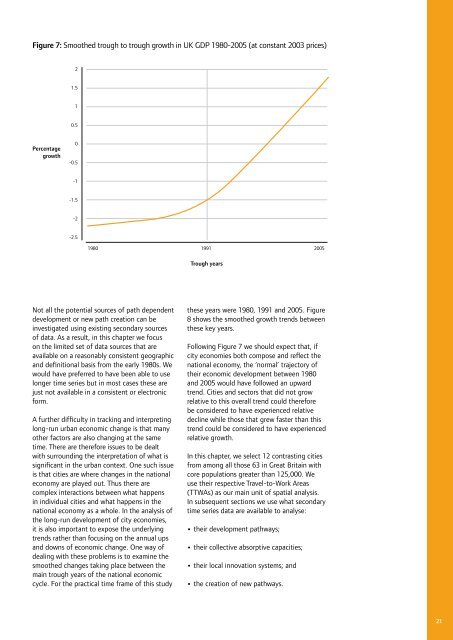
Figure 7: Smoothed trough to trough growth <strong>in</strong> UK GDP 1980-2005 (at constant 2003 prices)<br />
2<br />
1.5<br />
1<br />
0.5<br />
Percentage<br />
growth<br />
0<br />
-0.5<br />
-1<br />
-1.5<br />
-2<br />
-2.5<br />
1980 1991<br />
2005<br />
Trough years<br />
Not all the potential sources of path dependent<br />
development or new path creation can be<br />
<strong>in</strong>vestigated us<strong>in</strong>g exist<strong>in</strong>g secondary sources<br />
of data. As a result, <strong>in</strong> this chapter we focus<br />
on the limited set of data sources that are<br />
available on a reasonably consistent geographic<br />
<strong>and</strong> def<strong>in</strong>itional basis from the early 1980s. We<br />
would have preferred to have been able to use<br />
longer time series but <strong>in</strong> most cases these are<br />
just not available <strong>in</strong> a consistent or electronic<br />
form.<br />
A further difficulty <strong>in</strong> track<strong>in</strong>g <strong>and</strong> <strong>in</strong>terpret<strong>in</strong>g<br />
long-run urban economic change is that many<br />
other factors are also chang<strong>in</strong>g at the same<br />
time. There are therefore issues to be dealt<br />
with surround<strong>in</strong>g the <strong>in</strong>terpretation of what is<br />
significant <strong>in</strong> the urban context. One such issue<br />
is that cities are where changes <strong>in</strong> the national<br />
economy are played out. Thus there are<br />
complex <strong>in</strong>teractions between what happens<br />
<strong>in</strong> <strong>in</strong>dividual cities <strong>and</strong> what happens <strong>in</strong> the<br />
national economy as a whole. In the analysis of<br />
the long-run development of <strong>city</strong> economies,<br />
it is also important to expose the underly<strong>in</strong>g<br />
trends rather than focus<strong>in</strong>g on the annual ups<br />
<strong>and</strong> downs of economic change. One way of<br />
deal<strong>in</strong>g with these problems is to exam<strong>in</strong>e the<br />
smoothed changes tak<strong>in</strong>g place between the<br />
ma<strong>in</strong> trough years of the national economic<br />
cycle. For the practical time frame of this study<br />
these years were 1980, 1991 <strong>and</strong> 2005. Figure<br />
8 shows the smoothed growth trends between<br />
these key years.<br />
Follow<strong>in</strong>g Figure 7 we should expect that, if<br />
<strong>city</strong> economies both compose <strong>and</strong> reflect the<br />
national economy, the ‘normal’ trajectory of<br />
their economic development between 1980<br />
<strong>and</strong> 2005 would have followed an upward<br />
trend. Cities <strong>and</strong> sectors that did not grow<br />
relative to this overall trend could therefore<br />
be considered to have experienced relative<br />
decl<strong>in</strong>e while those that grew faster than this<br />
trend could be considered to have experienced<br />
relative growth.<br />
In this chapter, we select 12 contrast<strong>in</strong>g cities<br />
from among all those 63 <strong>in</strong> Great Brita<strong>in</strong> with<br />
core populations greater than 125,000. We<br />
use their respective Travel-to-Work Areas<br />
(TTWAs) as our ma<strong>in</strong> unit of spatial analysis.<br />
In subsequent sections we use what secondary<br />
time series data are available to analyse:<br />
• their development pathways;<br />
• their collective absorptive capacities;<br />
• their local <strong><strong>in</strong>novation</strong> systems; <strong>and</strong><br />
• the creation of new pathways.<br />
21